Pér
Pér is a village in Győr-Moson-Sopron county, Hungary.
Pér | |
|---|---|
 Flag  Coat of arms | |
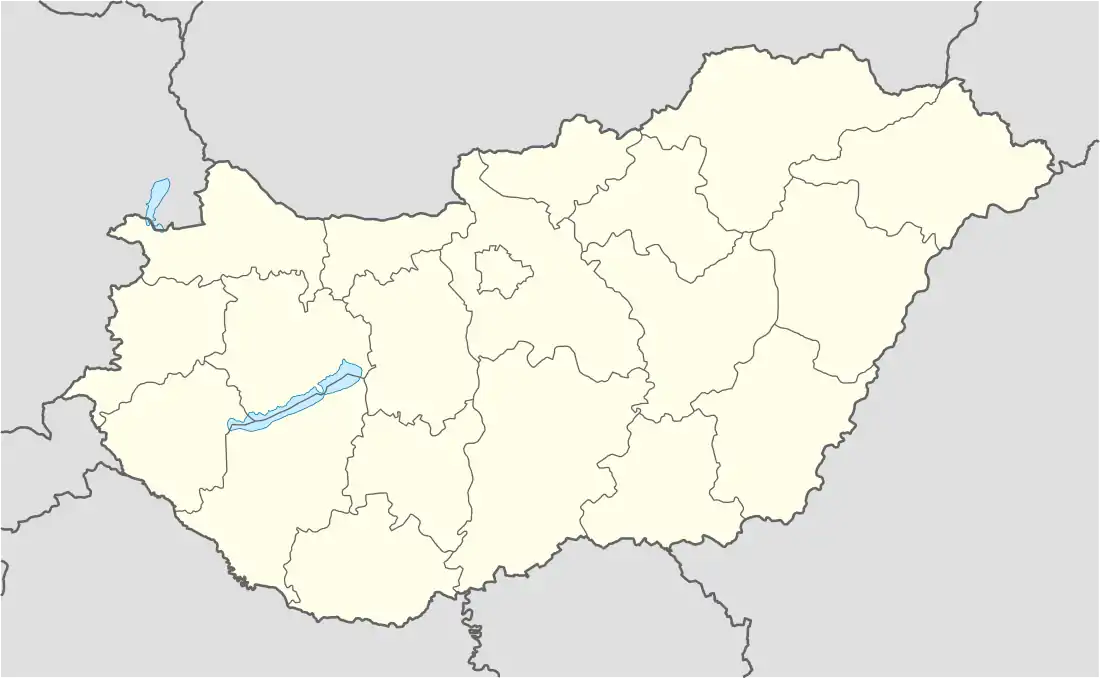 Pér Location of Pér | |
| Coordinates: 47.61305°N 17.80106°E | |
| Country | |
| County | Győr-Moson-Sopron |
| Area | |
| • Total | 31.48 km2 (12.15 sq mi) |
| Population (2019) | |
| • Total | 2,577 |
| • Density | 75.79/km2 (196.3/sq mi) |
| Time zone | UTC+1 (CET) |
| • Summer (DST) | UTC+2 (CEST) |
| Postal code | 9099 |
| Area code | 96 |
The settlement of the south-eastern part of the Bakony-Kisalföld reach the valley of the Győr Székesfehérvár with 81-number route, main Győr 15 km from the southeast can be found. This transition from the countryside to the plains and hills Sokorói (Pannonhalma Hills) is. The average altitude of 132 meters.
Climate
Pér's climate is classified as oceanic climate (Köppen Cfb). The annual average temperature is 10.7 °C (51.3 °F), the hottest month in July is 21.2 °C (70.2 °F), and the coldest month is 0.0 °C (32.0 °F) in January. The annual precipitation is 555.1 millimetres (21.85 in), of which July is the wettest with 66.8 millimetres (2.63 in), while February is the driest with only 25.4 millimetres (1.00 in). The extreme temperature throughout the year ranged from −22.0 °C (−7.6 °F) on December 28, 1996 to 40.1 °C (104.2 °F) on August 8, 2013.
| Climate data for Pér, 1991−2020 normals | |||||||||||||
|---|---|---|---|---|---|---|---|---|---|---|---|---|---|
| Month | Jan | Feb | Mar | Apr | May | Jun | Jul | Aug | Sep | Oct | Nov | Dec | Year |
| Record high °C (°F) | 17.4 (63.3) |
20.4 (68.7) |
23.1 (73.6) |
30.0 (86.0) |
32.0 (89.6) |
35.9 (96.6) |
39.6 (103.3) |
40.1 (104.2) |
32.9 (91.2) |
27.6 (81.7) |
22.8 (73.0) |
17.6 (63.7) |
40.1 (104.2) |
| Average high °C (°F) | 3.3 (37.9) |
5.8 (42.4) |
11.2 (52.2) |
17.2 (63.0) |
21.6 (70.9) |
25.4 (77.7) |
27.5 (81.5) |
27.5 (81.5) |
22.0 (71.6) |
16.1 (61.0) |
9.5 (49.1) |
4.0 (39.2) |
15.9 (60.6) |
| Daily mean °C (°F) | 0.0 (32.0) |
1.7 (35.1) |
5.8 (42.4) |
11.2 (52.2) |
15.7 (60.3) |
19.4 (66.9) |
21.2 (70.2) |
20.7 (69.3) |
15.9 (60.6) |
10.6 (51.1) |
5.6 (42.1) |
1.0 (33.8) |
10.7 (51.3) |
| Average low °C (°F) | −3.3 (26.1) |
−2.3 (27.9) |
0.8 (33.4) |
4.8 (40.6) |
9.2 (48.6) |
13.1 (55.6) |
14.6 (58.3) |
14.2 (57.6) |
10.2 (50.4) |
5.8 (42.4) |
2.3 (36.1) |
−1.9 (28.6) |
5.6 (42.1) |
| Record low °C (°F) | −18.6 (−1.5) |
−21.0 (−5.8) |
−20.3 (−4.5) |
−6.9 (19.6) |
−2.6 (27.3) |
3.0 (37.4) |
5.6 (42.1) |
4.9 (40.8) |
−0.7 (30.7) |
−9.8 (14.4) |
−12.2 (10.0) |
−22.0 (−7.6) |
−22.0 (−7.6) |
| Average precipitation mm (inches) | 31.5 (1.24) |
25.4 (1.00) |
33.9 (1.33) |
34.5 (1.36) |
62.4 (2.46) |
55.5 (2.19) |
66.8 (2.63) |
59.1 (2.33) |
59.1 (2.33) |
46.1 (1.81) |
44.1 (1.74) |
36.7 (1.44) |
555.1 (21.85) |
| Average precipitation days (≥ 1.0 mm) | 6.8 | 6.0 | 6.9 | 5.8 | 8.4 | 7.1 | 7.4 | 6.4 | 6.9 | 6.9 | 7.4 | 6.6 | 82.6 |
| Average relative humidity (%) | 84.4 | 79.1 | 71.9 | 65.6 | 69.9 | 69.2 | 67.4 | 69.4 | 74.8 | 80.4 | 85.3 | 85.9 | 75.3 |
| Source: NOAA[1] | |||||||||||||
References
- "Per Climate Normals 1991-2020". National Oceanic and Atmospheric Administration. Archived from the original on 2023-09-17. Retrieved September 17, 2023.