Demographics of São Tomé and Príncipe
Demographic features of the population of São Tomé and Príncipe include population density, ethnicity, education level, health of the populace, economic status, religious affiliations and other aspects.
| Demographics of São Tomé and Príncipe | |
|---|---|
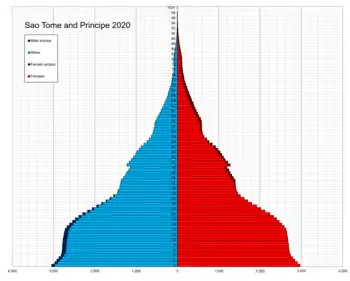 Population pyramid of Sao Tome and Principe in 2020 | |
| Population | 217,164 (2022 est.) |
| Growth rate | 1.48% (2022 est.) |
| Birth rate | 28.19 births/1,000 population (2022 est.) |
| Death rate | 6.2 deaths/1,000 population (2022 est.) |
| Net migration rate | -7.19 migrant(s)/1,000 population (2022 est.) |
| Age structure | |
| 0–14 years | 39.77% |
| 65 and over | 2.87% |
| Nationality | |
| Nationality | Sao Tomean |
Of São Tomé and Príncipe's total population of some 201,800,[1] about 193,380 live on São Tomé and 8,420 on Príncipe. All are descended from various ethnic groups that have migrated to the islands since 1485. 70% of the people on São Tomé and Príncipe are black and 30% of the people are mixed race, mostly black and white. Six groups are identifiable:
- Luso-Africans, or mixed-heritage, descendants of Portuguese colonists and African slaves brought to the islands during the early years of settlement from Benin, Gabon, the Republic of the Congo, the Democratic Republic of the Congo, and Angola (these people also are known as filhos da terra or "children of the land");
- Angolares, reputedly descendants of Angolan slaves who survived a 1540 shipwreck and now earn their livelihood fishing;
- Forros, descendants of freed slaves when slavery was abolished;
- Serviçais, contract laborers from Angola, Mozambique, and Cape Verde, living temporarily on the islands;
- Tongas, children of servicais born on the islands; and
- Europeans, primarily Portuguese.
- Asians, mostly Chinese minority, including Macanese people of mixed Portuguese and Chinese blood from Macau.
Although a small country, São Tomé and Príncipe has four national languages: Portuguese (the official language, spoken by 95% of the population), and the Portuguese-based creoles Forro (85%), Angolar (3%) and Principense (0.1%). French is also learned in schools, as the country is a member of Francophonie.
In the 1970s, there were two significant population movements—the exodus of most of the 4,000 Portuguese residents and the influx of several hundred São Toméan refugees from Angola. The islanders have been absorbed largely into a common Luso-African culture. Almost all belong to the Roman Catholic, Evangelical Protestant, or Seventh-day Adventist churches, which in turn retain close ties with churches in Portugal. There is a small but growing Muslim population.
Population
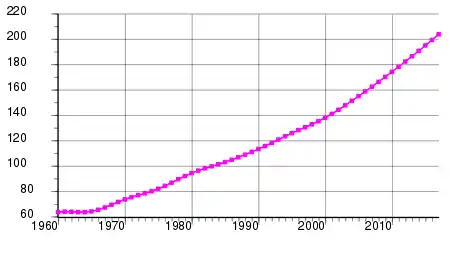
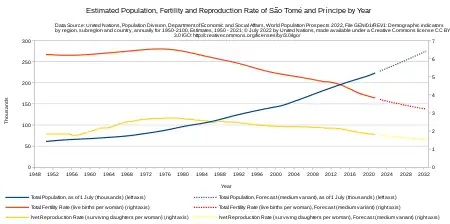
According to the 2022 revision of the world factbook the total population was 217,164 in 2022, compared to only 60,000 in 1950.[2] The proportion of children below the age of 15 in 2020 was 39.8%, 57.4% was between 15 and 65 years of age, while 2.9% was 65 years or older.[2]
| Total population[2] | Population aged 0–14 (%) | Population aged 15–64 (%) | Population aged 65+ (%) | |
|---|---|---|---|---|
| 1950 | 60,000 | 32.9 | 63.1 | 4.0 |
| 1955 | 59,000 | 32.9 | 63.1 | 4.0 |
| 1960 | 64,000 | 32.9 | 63.2 | 4.0 |
| 1965 | 65,000 | 41.1 | 56.3 | 2.6 |
| 1970 | 74,000 | 46.7 | 48.4 | 4.9 |
| 1975 | 82,000 | 47.0 | 49.1 | 3.9 |
| 1980 | 95,000 | 46.6 | 48.6 | 4.8 |
| 1985 | 104,000 | 46.6 | 48.8 | 4.7 |
| 1990 | 116,000 | 46.6 | 49.0 | 4.4 |
| 1995 | 128,000 | 44.8 | 50.8 | 4.4 |
| 2000 | 141,000 | 42.6 | 53.1 | 4.3 |
| 2005 | 153,000 | 41.6 | 54.0 | 4.4 |
| 2010 | 165,000 | 40.3 | 55.8 | 3.9 |
| 2020 | 211,122 | 39.8 | 57.4 | 2.9 |
Population Estimates by Sex and Age Group (01.VII.2017): [3]
| Age Group | Male | Female | Total | % |
|---|---|---|---|---|
| Total | 97 988 | 99 712 | 197 700 | 100 |
| 0–4 | 12 031 | 12 102 | 24 133 | 12.21 |
| 5–9 | 13 833 | 13 667 | 27 500 | 13.91 |
| 10–14 | 12 677 | 12 714 | 25 390 | 12.84 |
| 15–19 | 10 673 | 10 672 | 21 345 | 10.80 |
| 20–24 | 9 278 | 9 062 | 18 341 | 9.28 |
| 25–29 | 7 895 | 7 946 | 15 841 | 8.01 |
| 30–34 | 7 276 | 7 389 | 14 665 | 7.42 |
| 35–39 | 6 105 | 6 252 | 12 358 | 6.25 |
| 40–44 | 4 762 | 4 784 | 9 546 | 4.83 |
| 45–49 | 3 831 | 3 822 | 7 654 | 3.87 |
| 50–54 | 2 880 | 3 153 | 6 033 | 3.05 |
| 55–59 | 2 384 | 2 620 | 5 004 | 2.53 |
| 60–64 | 1 573 | 1 858 | 3 431 | 1.74 |
| 65-69 | 1 076 | 1 173 | 2 249 | 1.14 |
| 70-74 | 665 | 835 | 1 500 | 0.76 |
| 75-79 | 535 | 777 | 1 313 | 0.66 |
| 80+ | 514 | 886 | 1 400 | 0.71 |
| Age group | Male | Female | Total | Percent |
| 0–14 | 38 541 | 38 483 | 77 024 | 38.96 |
| 15–64 | 56 657 | 57 558 | 114 215 | 57.77 |
| 65+ | 2 790 | 3 671 | 6 461 | 3.27 |
Vital statistics
Registration of vital events is in São Tomé & Príncipe not available for recent years. The Population Departement of the United Nations prepared the following estimates. [4]
| Period | Live births per year | Deaths per year | Natural change per year | CBR* | CDR* | NC* | TFR* | IMR* |
|---|---|---|---|---|---|---|---|---|
| 1950-1955 | 3 000 | 1 000 | 2 000 | 47.7 | 21.0 | 26.7 | 6.20 | 124 |
| 1955-1960 | 3 000 | 1 000 | 2 000 | 47.7 | 18.5 | 29.2 | 6.20 | 112 |
| 1960-1965 | 3 000 | 1 000 | 2 000 | 47.0 | 16.8 | 30.1 | 6.30 | 99 |
| 1965-1970 | 3 000 | 1 000 | 2 000 | 42.7 | 13.1 | 29.6 | 6.40 | 88 |
| 1970-1975 | 3 000 | 1 000 | 2 000 | 40.7 | 13.2 | 27.6 | 6.52 | 80 |
| 1975-1980 | 4 000 | 1 000 | 3 000 | 41.1 | 11.0 | 30.1 | 6.50 | 70 |
| 1980-1985 | 4 000 | 1 000 | 3 000 | 40.4 | 11.5 | 28.9 | 6.24 | 66 |
| 1985-1990 | 4 000 | 1 000 | 3 000 | 38.8 | 10.7 | 28.1 | 5.66 | 63 |
| 1990-1995 | 5 000 | 1 000 | 3 000 | 37.0 | 9.8 | 27.1 | 5.16 | 61 |
| 1995-2000 | 5 000 | 1 000 | 4 000 | 35.9 | 9.2 | 26.7 | 4.80 | 58 |
| 2000-2005 | 5 000 | 1 000 | 4 000 | 34.8 | 8.8 | 26.0 | 4.34 | 55 |
| 2005-2010 | 5 000 | 1 000 | 4 000 | 32.4 | 8.2 | 24.2 | 3.85 | 52 |
| * CBR = crude birth rate (per 1000); CDR = crude death rate (per 1000); NC = natural change (per 1000); IMR = infant mortality rate per 1000 births; TFR = total fertility rate (number of children per woman) | ||||||||
Births and deaths [5]
| Year | Population | Live births | Deaths | Natural increase | Crude birth rate | Crude death rate | Rate of natural increase | TFR |
|---|---|---|---|---|---|---|---|---|
| 2012 | 5 173 | 1 287 | 3 886 | 27.6 | 6.9 | 20.7 | ||
| 2015 | 5 022 | 1 226 | 3 796 | |||||
| 2017 | 5 190 | 1 202 | 3 988 | 26.3 | 6.1 | 20.2 | ||
Fertility Rate (The Demographic Health Survey)
[6] Fertility Rate (TFR) (Wanted Fertility Rate) and CBR (Crude Birth Rate):
| Year | CBR (Total) | TFR (Total) | CBR (Urban) | TFR (Urban) | CBR (Rural) | TFR (Rural) |
|---|---|---|---|---|---|---|
| 2008-2009 | 34,5 | 4,9 (3,3) | 32,4 | 4,4 (3,0) | 36,7 | 5,5 (3,7) |
Fertility data as of 2008-2009 (DHS Program):[7]
| Region | Total fertility rate | Percentage of women age 15-49 currently pregnant | Mean number of children ever born to women age 40-49 |
|---|---|---|---|
| Centro | 4.6 | 8.2 | 5.5 |
| Sul | 5.4 | 8.3 | 6.2 |
| Norte | 5.7 | 8.8 | 6.7 |
| Príncipe | 5.0 | 11.6 | 6.1 |
Life expectancy
| Period | Life expectancy in Years[8] |
|---|---|
| 1950–1955 | 46.40 |
| 1955–1960 | |
| 1960–1965 | |
| 1965–1970 | |
| 1970–1975 | |
| 1975–1980 | |
| 1980–1985 | |
| 1985–1990 | |
| 1990–1995 | |
| 1995–2000 | |
| 2000–2005 | |
| 2005–2010 | |
| 2010–2015 |
Other demographic statistics
Demographic statistics according to the World Population Review in 2022.[9]
- One birth every 76 minutes
- One death every 480 minutes
- One net migrant every 360 minutes
- Net gain of one person every 120 minutes
The following demographic are from the CIA World Factbook[10] unless otherwise indicated.
Population
- 217,164 (2022 est.)
- 204,454 (July 2018 est.)
Religions
Catholic 55.7%, Adventist 4.1%, Assembly of God 3.4%, New Apostolic 2.9%, Mana 2.3%, Universal Kingdom of God 2%, Jehovah's Witness 1.2%, other 6.2%, none 21.2%, unspecified 1% (2012 est.)
Age structure
- 0-14 years: 39.77% (male 42,690/female 41,277)
- 15-24 years: 21.59% (male 23,088/female 22,487)
- 25-54 years: 31.61% (male 32,900/female 33,834)
- 55-64 years: 4.17% (male 4,095/female 4,700)
- 65 years and over: 2.87% (2020 est.) (male 2,631/female 3,420)
- 0-14 years: 41.2% (male 42,825 /female 41,403)
- 15-24 years: 21.01% (male 21,767 /female 21,188)
- 25-54 years: 31.03% (male 31,218 /female 32,229)
- 55-64 years: 3.93% (male 3,708 /female 4,332)
- 65 years and over: 2.83% (male 2,545 /female 3,239) (2018 est.)
Birth rate
- 28.19 births/1,000 population (2022 est.) Country comparison to the world: 36th
- 31.5 births/1,000 population (2018 est.) Country comparison to the world: 32nd
Death rate
- 6.2 deaths/1,000 population (2022 est.) Country comparison to the world: 149th
- 6.7 deaths/1,000 population (2018 est.) Country comparison to the world: 138th
Total fertility rate
- 3.56 children born/woman (2022 est.) Country comparison to the world: 36th
- 4.11 children born/woman (2018 est.) Country comparison to the world: 31st
Population growth rate
- 1.48% (2022 est.) Country comparison to the world: 65th
- 1.66% (2018 est.) Country comparison to the world: 62nd
Median age
- total: 19.3 years. Country comparison to the world: 204th
- male: 18.9 years
- female: 19.7 years (2020 est.)
- total: 18.7 years. Country comparison to the world: 207th
- male: 18.3 years
- female: 19.1 years (2018 est.)
Mother's mean age at first birth
- 19.4 years (2008/09 est.)
- note: median age at first birth among women 25-29
Contraceptive prevalence rate
- 49.7% (2019)
- 40.6% (2014)
Net migration rate
- -7.19 migrant(s)/1,000 population (2022 est.) Country comparison to the world: 214th
- -8.3 migrant(s)/1,000 population (2017 est.) Country comparison to the world: 207th
Dependency ratios
- total dependency ratio: 86.7 (2015 est.)
- youth dependency ratio: 81.1 (2015 est.)
- elderly dependency ratio: 5.6 (2015 est.)
- potential support ratio: 17.8 (2015 est.)
Urbanization
- urban population: 75.8% of total population (2022)
- rate of urbanization: 2.96% annual rate of change (2020-25 est.)
- urban population: 72.8% of total population (2018)
- rate of urbanization: 3.33% annual rate of change (2015-20 est.)
Life expectancy at birth
- total population: 67.06 years. Country comparison to the world: 194th
- male: 65.44 years
- female: 68.72 years (2022 est.)
- total population: 65.7 years
- male: 64.3 years
- female: 67.1 years (2018 est.)
- total population: 65.25 years
- male: 63.84 years
- female: 66.7 years (2000 est.)
Major infectious diseases
- degree of risk: high (2020)
- food or waterborne diseases: bacterial diarrhea, hepatitis A, and typhoid fever
- vectorborne diseases: malaria and dengue fever
- water contact diseases: schistosomiasis
Sex ratio
- at birth:
- male(s)/female
- under 15 years:
- 1.03 male(s)/female
- 15–64 years:
- 0.93 male(s)/female
- 65 years and over:
- 0.84 male(s)/female
- total population:
- 0.97 male(s)/female (2000 est.)
Nationality
noun:
São Toméan(s)
adjective:
São Toméan
Ethnic groups
Mestiços, angolares (descendants of Angolan slaves), forros (descendants of freed slaves), serviçais (contract laborers from Angola, Mozambique, and Cape Verde), tongas (children of serviçais born on the islands) and Europeans (primarily Portuguese).
Languages
Portuguese 98.4% (official), Forro 36.2%, Cabo Verdian 8.5%, French 6.8%, Angolar 6.6%, English 4.9%, Lunguie 1%, Other (including sign language) 2.4% [11]
Education expenditures
- 5.9% of GDP (2019) Country comparison to the world: 35th
Literacy
definition: age 15 and over can read and write
- total population: 92.8%
- male: 96.2%
- female: 89.5% (2018)
- total population: 74.9% (2015 est.)
- male: 81.8% (2015 est.)
- female: 68.4% (2015 est.)
- total population: 73%
- male: 85%
- female: 62% (1991 est.)
School life expectancy (primary to tertiary education)
- total: 12 years (2015)
- male: 12 years (2015)
- female: 13 years (2015)
Unemployment, youth ages 15-24
- total: 20.8% (2012 est.)
References
- official estimate as at 13 May 2018 by Instituto Nacional de Estatistica.
- "Sao Tome and Principe". 19 April 2022.
- "UNSD — Demographic and Social Statistics".
- Population Division of the Department of Economic and Social Affairs of the United Nations Secretariat, World Population Prospects: The 2010 Revision Archived May 6, 2011, at the Wayback Machine
- ". Live births, deaths, and infant deaths, latest available year (2002 - 2016)" (PDF). Unstats.un.org. Retrieved 7 November 2017.
- "The DHS Program - Quality information to plan, monitor and improve population, health, and nutrition programs". Dhsprogram.com. Retrieved 2017-07-12.
- "Inquérito Demográfico e Sanitário 2008-2009" (PDF). Dhsprogram.com. Retrieved 7 November 2017.
- "World Population Prospects - Population Division - United Nations". esa.un.org. Retrieved 2018-08-26.
- "Sao Tome and Principe Population 2022", World Population Review
- "The World FactBook - Sao Tome and Principe", The World Factbook, 2022
 This article incorporates text from this source, which is in the public domain.
 - "Africa :: SAO TOME AND PRINCIPE". CIA The World Factbook. 19 April 2022.