Portal:Agriculture/Selected article/28
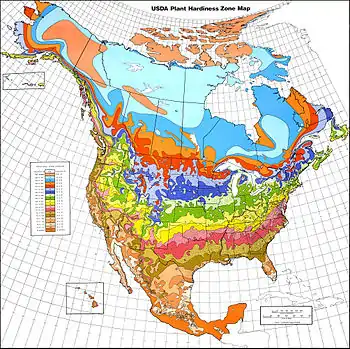
A hardiness zone (a subcategory of Vertical Zonation) is a geographically defined area in which a specific category of plant life is capable of growing, as defined by climatic conditions, including its ability to withstand the minimum temperatures of the zone (see the scale on the right or the table below). For example, a plant that is described as "hardy to zone 10" means that the plant can withstand a minimum temperature of -1°C. A more resilient plant that is "hardy to zone 9" can tolerate a minimum temperature of -7°C. First developed for the United States by the Department of Agriculture (USDA), the use of the zones has been adopted by other nations.

Based on the average annual minimum temperature for a given location, the USDA map provides an easy guideline for categorizing locations suitable for winter survival of a rated plant in an "average" winter. Since temperatures in the non-coastal-adjacent areas of the continent rarely present a consistent experience from year to year, and occasionally present a major—and often agriculturally devastating—deviation from the average minimum, the map has limitations for much of the country as a basis for using with long-term reliability, at least in areas close to the margin of a plant's rated hardiness-zone.
In 2003, the American Horticultural Society (AHS) produced a draft revised map, using temperature data collected from July 1986 to March 2002. This was a period of warmer winters than the 1974–1986 period, especially in the eastern U.S.A. The 2003 map placed many areas approximately a half-zone higher (warmer) than the 1990 map had. Reviewers noted the map zones appeared to be closer to the original 1960 map in its overall zone delineations. The 2003 AHS draft map purported to show finer detail, for example, reflecting urban heat islands by showing the downtown areas of several cities (e.g., Baltimore, Maryland, Washington, D.C. and Atlantic City, New Jersey) as a full zone warmer than outlying areas. The map excluded the detailed a/b half-zones introduced in the 1990 map, an omission widely criticized by horticulturists and gardeners due to the coarseness of the resulting map. The USDA rejected the AHS 2003 draft map; the agency stated it would create its own map in an interactive computer format. As of August 2010 the AHS and the National Arboretum websites still present the 1990 map as current. In 2006, the US National Arbor Day Foundation completed an extensive updating of U.S. Hardiness Zones. It used essentially the same data as the AHS. Once the Foundation analyzed the new data, it revised hardiness zones, reflecting the generally warmer recent temperatures in many parts of the country. The Foundation's 2006 map appears to validate the data used in the AHS 2003 draft. The Foundation also did away with the more detailed a/b half-zone delineations. (Full article...)