Pseudoreplication
Pseudoreplication (sometimes unit of analysis error[1]) has many definitions. Pseudoreplication was originally defined in 1984 by Stuart H. Hurlbert[2] as the use of inferential statistics to test for treatment effects with data from experiments where either treatments are not replicated (though samples may be) or replicates are not statistically independent. Subsequently, Millar and Anderson [3] identified it as a special case of inadequate specification of random factors where both random and fixed factors are present. It is sometimes narrowly interpreted as an inflation of the number of samples or replicates which are not statistically independent.[4] This definition omits the confounding of unit and treatment effects in a misspecified F-ratio. In practice, incorrect F-ratios for statistical tests of fixed effects often arise from a default F-ratio that is formed over the error rather the mixed term.
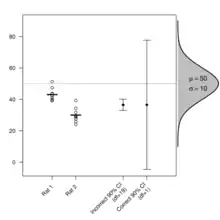
Lazic [5] defined pseudoreplication as a problem of correlated samples (e.g. from longitudinal studies) where correlation is not taken into account when computing the confidence interval for the sample mean. For the effect of serial or temporal correlation also see Markov chain central limit theorem.

The problem of inadequate specification arises when treatments are assigned to units that are subsampled and the treatment F-ratio in an analysis of variance (ANOVA) table is formed with respect to the residual mean square rather than with respect to the among unit mean square. The F-ratio relative to the within unit mean square is vulnerable to the confounding of treatment and unit effects, especially when experimental unit number is small (e.g. four tank units, two tanks treated, two not treated, several subsamples per tank). The problem is eliminated by forming the F-ratio relative to the correct mean square in the ANOVA table (tank by treatment MS in the example above), where this is possible. The problem is addressed by the use of mixed models.[3]
Hurlbert reported "pseudoreplication" in 48% of the studies he examined, that used inferential statistics.[2] Several studies examining scientific papers published up to 2016 similarly found about half of the papers were suspected of pseudoreplication.[4] When time and resources limit the number of experimental units, and unit effects cannot be eliminated statistically by testing over the unit variance, it is important to use other sources of information to evaluate the degree to which an F-ratio is confounded by unit effects.
Replication
Replication increases the precision of an estimate, while randomization addresses the broader applicability of a sample to a population. Replication must be appropriate: replication at the experimental unit level must be considered, in addition to replication within units.
Hypothesis testing
Statistical tests (e.g. t-test and the related ANOVA family of tests) rely on appropriate replication to estimate statistical significance. Tests based on the t and F distributions assume homogeneous, normal, and independent errors. Correlated errors can lead to false precision and p-values that are too small.[6]
Types
Hurlbert (1984) defined four types of pseudoreplication.
- Simple pseudoreplication (Figure 5a in Hurlbert 1984) occurs when there is one experimental unit per treatment. Inferential statistics cannot separate variability due to treatment from variability due to experimental units when there is only one measurement per unit.
- Temporal pseudoreplication (Figure 5c in Hurlbert 1984) occurs when experimental units differ enough in time that temporal effects among units are likely, and treatment effects are correlated with temporal effects. Inferential statistics cannot separate variability due to treatment from variability due to experimental units when there is only one measurement per unit.
- Sacrificial pseudoreplication (Figure 5b in Hurlbert 1984) occurs when means within a treatment are used in an analysis, and these means are tested over the within unit variance. In Figure 5b the erroneous F-ratio will have 1 df in the numerator (treatment) mean square and 4 df in the denominator mean square(2-1 = 1 df for each experimental unit). The correct F-ratio will have 1 df in the numerator (treatment) and 2 df in the denominator (2-1 = 1 df for each treatment). The correct F-ratio controls for effects of experimental units but with 2 df in the denominator it will have little power to detect treatment differences.
- Implicit pseudoreplication occurs when standard errors (or confidence limits) are estimated within experimental units. As with other sources of pseudoreplication, treatment effects cannot be statistically separated from effects due to variation among experimental units.
References
- Hurlbert, Stuart H. (2009). "The ancient black art and transdisciplinary extent of pseudoreplication". Journal of Comparative Psychology. 123 (4): 434–443. doi:10.1037/a0016221. ISSN 1939-2087. PMID 19929111.
- Hurlbert, Stuart H. (1984). "Pseudoreplication and the design of ecological field experiments" (PDF). Ecological Monographs. Ecological Society of America. 54 (2): 187–211. doi:10.2307/1942661. JSTOR 1942661.
- Millar, R.B.; Anderson, M.R. (2004). "Remedies for pseudoreplication". Fisheries Research. 70 (2–3): 397–407. doi:10.1016/j.fishres.2004.08.016.
- Gholipour, Bahar (2018-03-15). "Statistical errors may taint as many as half of mouse studies". Spectrum | Autism Research News. Retrieved 2018-03-24.
- E, Lazic, Stanley (2010-01-14). "The problem of pseudoreplication in neuroscientific studies: is it affecting your analysis?". BMC Neuroscience. BioMed Central Ltd. 11: 5. doi:10.1186/1471-2202-11-5. OCLC 805414397. PMC 2817684. PMID 20074371.
{{cite journal}}: CS1 maint: multiple names: authors list (link) - Lazic, SE (2010). "The problem of pseudoreplication in neuroscientific studies: is it affecting your analysis?". BMC Neuroscience. 11:5: 5. doi:10.1186/1471-2202-11-5. PMC 2817684. PMID 20074371.