Rødovre (nomination district)
Rødovre nominating district is one of the 92 nominating districts that exists for Danish elections following the 2007 municipal reform.[3][4][5] It consists of Herlev and Rødovre municipality.[6] It was created in 1966[7] and has maintained its boundaries since then.
| Rødovre | |
|---|---|
| Rødovre | |
| Nomination district constituency for the Folketing | |
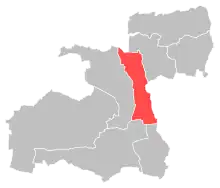 Location of Rødovre within Greater Copenhagen | |
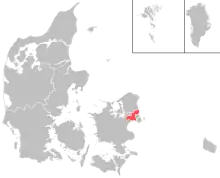 Location of Greater Copenhagen within Denmark | |
| Municipalities | Herlev Rødovre |
| Constituency | Greater Copenhagen |
| Electorate | 48,504 (2022)[1] |
| Current constituency | |
| Created | 1966[2] |
In general elections, the district is a strong area for parties commonly associated with the red bloc.[8]
General elections results
General elections in the 2020s
| Parties | Vote | |||||
|---|---|---|---|---|---|---|
| Votes | % | + / - | ||||
| Social Democrats | 12,830 | 33.36 | +1.71 | |||
| Green Left | 3,851 | 10.01 | -0.21 | |||
| Moderates | 3,742 | 9.73 | New | |||
| Venstre | 3,102 | 8.07 | -6.57 | |||
| Liberal Alliance | 2,431 | 6.32 | +4.37 | |||
| Red–Green Alliance | 2,423 | 6.30 | -2.31 | |||
| Conservatives | 1,945 | 5.06 | -0.82 | |||
| Denmark Democrats | 1,624 | 4.22 | New | |||
| Danish People's Party | 1,550 | 4.03 | -4.91 | |||
| Social Liberals | 1,546 | 4.02 | -4.38 | |||
| New Right | 1,212 | 3.15 | +0.83 | |||
| The Alternative | 1,107 | 2.88 | +0.10 | |||
| Independent Greens | 854 | 2.22 | New | |||
| Christian Democrats | 195 | 0.51 | -0.70 | |||
| Jovan Tasevski | 41 | 0.11 | New | |||
| Henrik Vendelbo Petersen | 7 | 0.02 | New | |||
| Total | 38,460 | |||||
| Source[9] | ||||||
General elections in the 2010s
| Parties | Vote | |||||
|---|---|---|---|---|---|---|
| Votes | % | + / - | ||||
| Social Democrats | 12,547 | 31.65 | -2.14 | |||
| Venstre | 5,803 | 14.64 | +2.44 | |||
| Green Left | 4,051 | 10.22 | +5.18 | |||
| Danish People's Party | 3,545 | 8.94 | -13.25 | |||
| Red–Green Alliance | 3,414 | 8.61 | -0.97 | |||
| Social Liberals | 3,330 | 8.40 | +4.59 | |||
| Conservatives | 2,331 | 5.88 | +2.93 | |||
| The Alternative | 1,101 | 2.78 | -1.29 | |||
| New Right | 918 | 2.32 | New | |||
| Stram Kurs | 909 | 2.29 | New | |||
| Liberal Alliance | 774 | 1.95 | -3.64 | |||
| Christian Democrats | 479 | 1.21 | +0.52 | |||
| Klaus Riskær Pedersen Party | 304 | 0.77 | New | |||
| Mads Palsvig | 138 | 0.35 | New | |||
| Christian B. Olesen | 5 | 0.01 | New | |||
| Total | 39,649 | |||||
| Source[10] | ||||||
| Parties | Vote | |||||
|---|---|---|---|---|---|---|
| Votes | % | + / - | ||||
| Social Democrats | 13,200 | 33.79 | +2.44 | |||
| Danish People's Party | 8,666 | 22.19 | +7.92 | |||
| Venstre | 4,765 | 12.20 | -6.26 | |||
| Red–Green Alliance | 3,741 | 9.58 | +1.43 | |||
| Liberal Alliance | 2,184 | 5.59 | +1.84 | |||
| Green Left | 1,967 | 5.04 | -4.80 | |||
| The Alternative | 1,591 | 4.07 | New | |||
| Social Liberals | 1,488 | 3.81 | -4.97 | |||
| Conservatives | 1,151 | 2.95 | -1.81 | |||
| Christian Democrats | 268 | 0.69 | +0.13 | |||
| Asif Ahmad | 33 | 0.08 | New | |||
| Christian Olesen | 7 | 0.02 | New | |||
| Total | 39,061 | |||||
| Source[11] | ||||||
| Parties | Vote | |||||
|---|---|---|---|---|---|---|
| Votes | % | + / - | ||||
| Social Democrats | 12,413 | 31.35 | -1.84 | |||
| Venstre | 7,308 | 18.46 | +2.07 | |||
| Danish People's Party | 5,649 | 14.27 | -2.20 | |||
| Green Left | 3,897 | 9.84 | -4.79 | |||
| Social Liberals | 3,478 | 8.78 | +4.35 | |||
| Red–Green Alliance | 3,226 | 8.15 | +5.64 | |||
| Conservatives | 1,884 | 4.76 | -4.50 | |||
| Liberal Alliance | 1,486 | 3.75 | +1.40 | |||
| Christian Democrats | 222 | 0.56 | -0.20 | |||
| Christian H. Hansen | 31 | 0.08 | New | |||
| Total | 39,594 | |||||
| Source[12] | ||||||
General elections in the 2000s
| Parties | Vote | |||||
|---|---|---|---|---|---|---|
| Votes | % | + / - | ||||
| Social Democrats | 13,044 | 33.19 | -0.08 | |||
| Danish People's Party | 6,474 | 16.47 | -0.23 | |||
| Venstre | 6,442 | 16.39 | -3.07 | |||
| Green Left | 5,750 | 14.63 | +7.66 | |||
| Conservatives | 3,641 | 9.26 | +0.59 | |||
| Social Liberals | 1,742 | 4.43 | -3.58 | |||
| Red–Green Alliance | 985 | 2.51 | -1.54 | |||
| New Alliance | 923 | 2.35 | New | |||
| Christian Democrats | 299 | 0.76 | -0.61 | |||
| Janus Kramer Møller | 2 | 0.01 | New | |||
| Feride Istogu Gillesberg | 0 | 0.00 | New | |||
| Total | 39,302 | |||||
| Source[13] | ||||||
| Parties | Vote | |||||
|---|---|---|---|---|---|---|
| Votes | % | + / - | ||||
| Social Democrats | 12,877 | 33.27 | -3.54 | |||
| Venstre | 7,530 | 19.46 | -2.71 | |||
| Danish People's Party | 6,464 | 16.70 | +1.38 | |||
| Conservatives | 3,354 | 8.67 | +1.74 | |||
| Social Liberals | 3,100 | 8.01 | +3.87 | |||
| Green Left | 2,696 | 6.97 | -0.89 | |||
| Red–Green Alliance | 1,566 | 4.05 | +1.34 | |||
| Christian Democrats | 530 | 1.37 | -0.46 | |||
| Centre Democrats | 465 | 1.20 | -0.72 | |||
| Minority Party | 110 | 0.28 | New | |||
| Nahid Yazdanyar | 8 | 0.02 | New | |||
| Total | 38,700 | |||||
| Source[14] | ||||||
| Parties | Vote | |||||
|---|---|---|---|---|---|---|
| Votes | % | + / - | ||||
| Social Democrats | 15,026 | 36.81 | -5.61 | |||
| Venstre | 9,049 | 22.17 | +8.05 | |||
| Danish People's Party | 6,253 | 15.32 | +4.47 | |||
| Green Left | 3,209 | 7.86 | -1.95 | |||
| Conservatives | 2,831 | 6.93 | -1.17 | |||
| Social Liberals | 1,688 | 4.14 | +1.09 | |||
| Red–Green Alliance | 1,108 | 2.71 | -0.48 | |||
| Centre Democrats | 784 | 1.92 | -2.98 | |||
| Christian People's Party | 749 | 1.83 | +0.05 | |||
| Progress Party | 125 | 0.31 | -0.97 | |||
| Total | 40,822 | |||||
| Source[15] | ||||||
General elections in the 1990s
| Parties | Vote | |||||
|---|---|---|---|---|---|---|
| Votes | % | + / - | ||||
| Social Democrats | 17,127 | 42.42 | +2.75 | |||
| Venstre | 5,700 | 14.12 | +1.72 | |||
| Danish People's Party | 4,382 | 10.85 | New | |||
| Green Left | 3,962 | 9.81 | -0.30 | |||
| Conservatives | 3,269 | 8.10 | -8.58 | |||
| Centre Democrats | 1,980 | 4.90 | +0.90 | |||
| Red–Green Alliance | 1,288 | 3.19 | -0.86 | |||
| Social Liberals | 1,231 | 3.05 | -1.15 | |||
| Christian People's Party | 718 | 1.78 | +0.38 | |||
| Progress Party | 516 | 1.28 | -4.76 | |||
| Democratic Renewal | 99 | 0.25 | New | |||
| Mogens Glistrup | 96 | 0.24 | -0.16 | |||
| Poul Bregninge | 3 | 0.01 | New | |||
| Anders Kofoed | 0 | 0.00 | New | |||
| Total | 40,371 | |||||
| Source[16] | ||||||
| Parties | Vote | |||||
|---|---|---|---|---|---|---|
| Votes | % | + / - | ||||
| Social Democrats | 15,936 | 39.67 | -4.21 | |||
| Conservatives | 6,700 | 16.68 | +0.09 | |||
| Venstre | 4,980 | 12.40 | +5.81 | |||
| Green Left | 4,062 | 10.11 | -0.50 | |||
| Progress Party | 2,426 | 6.04 | +2.32 | |||
| Social Liberals | 1,688 | 4.20 | +1.04 | |||
| Red–Green Alliance | 1,627 | 4.05 | +1.97 | |||
| Centre Democrats | 1,608 | 4.00 | -3.19 | |||
| Christian People's Party | 563 | 1.40 | -0.08 | |||
| Niels I. Meyer | 239 | 0.59 | New | |||
| Preben Møller Hansen | 173 | 0.43 | New | |||
| Mogens Glistrup | 161 | 0.40 | New | |||
| Torben Faber | 9 | 0.02 | New | |||
| John Ziegler | 1 | 0.00 | New | |||
| Total | 40,173 | |||||
| Source[17] | ||||||
| Parties | Vote | |||||
|---|---|---|---|---|---|---|
| Votes | % | + / - | ||||
| Social Democrats | 17,361 | 43.88 | +10.14 | |||
| Conservatives | 6,565 | 16.59 | -2.21 | |||
| Green Left | 4,198 | 10.61 | -7.64 | |||
| Centre Democrats | 2,845 | 7.19 | +1.84 | |||
| Venstre | 2,607 | 6.59 | +3.31 | |||
| Progress Party | 1,472 | 3.72 | -3.44 | |||
| Social Liberals | 1,250 | 3.16 | -2.88 | |||
| Common Course | 1,242 | 3.14 | +0.54 | |||
| Red–Green Alliance | 823 | 2.08 | New | |||
| Christian People's Party | 584 | 1.48 | +0.22 | |||
| The Greens | 347 | 0.88 | -0.81 | |||
| Justice Party of Denmark | 259 | 0.65 | New | |||
| Humanist Party | 14 | 0.04 | New | |||
| Total | 39,567 | |||||
| Source[18] | ||||||
General elections in the 1980s
| Parties | Vote | |||||
|---|---|---|---|---|---|---|
| Votes | % | + / - | ||||
| Social Democrats | 14,060 | 33.74 | +1.83 | |||
| Conservatives | 7,833 | 18.80 | -0.47 | |||
| Green Left | 7,604 | 18.25 | -3.15 | |||
| Progress Party | 2,982 | 7.16 | +3.39 | |||
| Social Liberals | 2,516 | 6.04 | -0.62 | |||
| Centre Democrats | 2,231 | 5.35 | -0.22 | |||
| Venstre | 1,367 | 3.28 | +1.25 | |||
| Common Course | 1,084 | 2.60 | -0.41 | |||
| The Greens | 706 | 1.69 | +0.27 | |||
| Communist Party of Denmark | 540 | 1.30 | -0.03 | |||
| Christian People's Party | 527 | 1.26 | -0.22 | |||
| Left Socialists | 216 | 0.52 | -0.75 | |||
| Leif Hilt | 0 | 0.00 | New | |||
| Total | 41,666 | |||||
| Source[19] | ||||||
| Parties | Vote | |||||
|---|---|---|---|---|---|---|
| Votes | % | + / - | ||||
| Social Democrats | 13,634 | 31.91 | -5.02 | |||
| Green Left | 9,145 | 21.40 | +4.58 | |||
| Conservatives | 8,232 | 19.27 | -2.23 | |||
| Social Liberals | 2,846 | 6.66 | +0.59 | |||
| Centre Democrats | 2,379 | 5.57 | +1.14 | |||
| Progress Party | 1,611 | 3.77 | +0.80 | |||
| Common Course | 1,288 | 3.01 | New | |||
| Venstre | 868 | 2.03 | -1.31 | |||
| Christian People's Party | 631 | 1.48 | -0.04 | |||
| The Greens | 606 | 1.42 | New | |||
| Communist Party of Denmark | 567 | 1.33 | +0.18 | |||
| Left Socialists | 544 | 1.27 | -1.71 | |||
| Justice Party of Denmark | 249 | 0.58 | -1.62 | |||
| Humanist Party | 94 | 0.22 | New | |||
| Socialist Workers Party | 18 | 0.04 | -0.03 | |||
| Marxist–Leninists Party | 13 | 0.03 | +0.01 | |||
| Carsten Grøn-Nielsen | 3 | 0.01 | +0.01 | |||
| Per Hillersborg | 0 | 0.00 | New | |||
| Total | 42,728 | |||||
| Source[20] | ||||||
| Parties | Vote | |||||
|---|---|---|---|---|---|---|
| Votes | % | + / - | ||||
| Social Democrats | 16,251 | 36.93 | -0.83 | |||
| Conservatives | 9,460 | 21.50 | +7.46 | |||
| Green Left | 7,403 | 16.82 | +0.42 | |||
| Social Liberals | 2,669 | 6.07 | +0.64 | |||
| Centre Democrats | 1,948 | 4.43 | -3.69 | |||
| Venstre | 1,468 | 3.34 | +1.08 | |||
| Left Socialists | 1,312 | 2.98 | -0.29 | |||
| Progress Party | 1,309 | 2.97 | -4.31 | |||
| Justice Party of Denmark | 967 | 2.20 | +0.18 | |||
| Christian People's Party | 670 | 1.52 | +0.35 | |||
| Communist Party of Denmark | 504 | 1.15 | -0.84 | |||
| Socialist Workers Party | 30 | 0.07 | +0.01 | |||
| Marxist–Leninists Party | 9 | 0.02 | New | |||
| Carsten Grøn-Nielsen | 1 | 0.00 | New | |||
| Mogens Nebelong | 0 | 0.00 | -0.02 | |||
| Poul Rasmussen | 0 | 0.00 | New | |||
| Total | 44,001 | |||||
| Source[21] | ||||||
| Parties | Vote | |||||
|---|---|---|---|---|---|---|
| Votes | % | + / - | ||||
| Social Democrats | 15,740 | 37.76 | -6.89 | |||
| Green Left | 6,838 | 16.40 | +7.88 | |||
| Conservatives | 5,853 | 14.04 | +2.21 | |||
| Centre Democrats | 3,385 | 8.12 | +5.18 | |||
| Progress Party | 3,036 | 7.28 | -0.98 | |||
| Social Liberals | 2,264 | 5.43 | -0.91 | |||
| Left Socialists | 1,364 | 3.27 | -1.71 | |||
| Venstre | 941 | 2.26 | -1.43 | |||
| Justice Party of Denmark | 844 | 2.02 | -1.98 | |||
| Communist Party of Denmark | 829 | 1.99 | -0.89 | |||
| Christian People's Party | 488 | 1.17 | -0.15 | |||
| Communist Workers Party | 73 | 0.18 | -0.41 | |||
| Socialist Workers Party | 26 | 0.06 | New | |||
| Mogens Nebelong | 8 | 0.02 | New | |||
| Total | 41,689 | |||||
| Source[22] | ||||||
General elections in the 1970s
| Parties | Vote | |||||
|---|---|---|---|---|---|---|
| Votes | % | + / - | ||||
| Social Democrats | 19,074 | 44.65 | +0.48 | |||
| Conservatives | 5,053 | 11.83 | +4.39 | |||
| Green Left | 3,641 | 8.52 | +2.72 | |||
| Progress Party | 3,528 | 8.26 | -4.09 | |||
| Social Liberals | 2,707 | 6.34 | +3.36 | |||
| Left Socialists | 2,127 | 4.98 | +1.49 | |||
| Justice Party of Denmark | 1,707 | 4.00 | -0.82 | |||
| Venstre | 1,576 | 3.69 | +0.28 | |||
| Centre Democrats | 1,256 | 2.94 | -4.96 | |||
| Communist Party of Denmark | 1,231 | 2.88 | -2.40 | |||
| Christian People's Party | 563 | 1.32 | -0.40 | |||
| Communist Workers Party | 253 | 0.59 | New | |||
| Total | 42,716 | |||||
| Source[23] | ||||||
| Parties | Vote | |||||
|---|---|---|---|---|---|---|
| Votes | % | + / - | ||||
| Social Democrats | 18,439 | 44.17 | +9.81 | |||
| Progress Party | 5,156 | 12.35 | -1.64 | |||
| Centre Democrats | 3,298 | 7.90 | +5.13 | |||
| Conservatives | 3,107 | 7.44 | +1.54 | |||
| Green Left | 2,422 | 5.80 | -2.35 | |||
| Communist Party of Denmark | 2,204 | 5.28 | -0.77 | |||
| Justice Party of Denmark | 2,013 | 4.82 | +2.48 | |||
| Left Socialists | 1,458 | 3.49 | +1.11 | |||
| Venstre | 1,423 | 3.41 | -10.05 | |||
| Social Liberals | 1,245 | 2.98 | -3.98 | |||
| Christian People's Party | 717 | 1.72 | -1.91 | |||
| Pensioners' Party | 265 | 0.63 | New | |||
| Otto Jensen | 2 | 0.00 | New | |||
| Poul Rasmussen | 1 | 0.00 | New | |||
| Total | 41,750 | |||||
| Source[24] | ||||||
| Parties | Vote | |||||
|---|---|---|---|---|---|---|
| Votes | % | + / - | ||||
| Social Democrats | 13,709 | 34.36 | +7.16 | |||
| Progress Party | 5,581 | 13.99 | -1.14 | |||
| Venstre | 5,371 | 13.46 | +9.04 | |||
| Green Left | 3,250 | 8.15 | -1.63 | |||
| Social Liberals | 2,779 | 6.96 | -2.42 | |||
| Communist Party of Denmark | 2,414 | 6.05 | +0.70 | |||
| Conservatives | 2,354 | 5.90 | -3.43 | |||
| Christian People's Party | 1,447 | 3.63 | +1.45 | |||
| Centre Democrats | 1,104 | 2.77 | -8.91 | |||
| Left Socialists | 949 | 2.38 | +0.38 | |||
| Justice Party of Denmark | 934 | 2.34 | -1.21 | |||
| J. G. Amdrejcak | 5 | 0.01 | New | |||
| Poul Friborg | 3 | 0.01 | New | |||
| Kai Clemmensen | 0 | 0.00 | New | |||
| Henning Glahn | 0 | 0.00 | New | |||
| Total | 39,900 | |||||
| Source[25] | ||||||
| Parties | Vote | |||||
|---|---|---|---|---|---|---|
| Votes | % | + / - | ||||
| Social Democrats | 10,917 | 27.20 | -12.55 | |||
| Progress Party | 6,073 | 15.13 | New | |||
| Centre Democrats | 4,688 | 11.68 | New | |||
| Green Left | 3,924 | 9.78 | -4.86 | |||
| Social Liberals | 3,766 | 9.38 | -3.97 | |||
| Conservatives | 3,745 | 9.33 | -11.38 | |||
| Communist Party of Denmark | 2,148 | 5.35 | +3.35 | |||
| Venstre | 1,772 | 4.42 | -0.08 | |||
| Justice Party of Denmark | 1,424 | 3.55 | +1.72 | |||
| Christian People's Party | 875 | 2.18 | +1.19 | |||
| Left Socialists | 801 | 2.00 | -0.08 | |||
| Erik Dissing | 0 | 0.00 | New | |||
| Total | 40,133 | |||||
| Source[26] | ||||||
| Parties | Vote | |||||
|---|---|---|---|---|---|---|
| Votes | % | + / - | ||||
| Social Democrats | 15,441 | 39.75 | +5.72 | |||
| Conservatives | 8,045 | 20.71 | -4.32 | |||
| Green Left | 5,688 | 14.64 | +4.98 | |||
| Social Liberals | 5,185 | 13.35 | -5.02 | |||
| Venstre | 1,747 | 4.50 | -0.14 | |||
| Left Socialists | 809 | 2.08 | -1.56 | |||
| Communist Party of Denmark | 778 | 2.00 | +0.48 | |||
| Justice Party of Denmark | 710 | 1.83 | +1.23 | |||
| Christian People's Party | 383 | 0.99 | New | |||
| Henning Berthelsen | 62 | 0.16 | New | |||
| Total | 38,848 | |||||
| Source[27] | ||||||
General elections in the 1960s
| Parties | Vote | |||||
|---|---|---|---|---|---|---|
| Votes | % | + / - | ||||
| Social Democrats | 13,184 | 34.03 | -5.88 | |||
| Conservatives | 9,696 | 25.03 | +5.96 | |||
| Social Liberals | 7,116 | 18.37 | +10.34 | |||
| Green Left | 3,744 | 9.66 | -9.42 | |||
| Venstre | 1,799 | 4.64 | -1.87 | |||
| Left Socialists | 1,410 | 3.64 | New | |||
| Liberal Centre | 896 | 2.31 | -2.57 | |||
| Communist Party of Denmark | 588 | 1.52 | +0.31 | |||
| Justice Party of Denmark | 231 | 0.60 | +0.07 | |||
| Independent Party | 77 | 0.20 | -0.57 | |||
| H. Søndersted Andersen | 1 | 0.01 | New | |||
| Kirsten Lonning | 1 | 0.01 | New | |||
| Thode Karlsen | 1 | 0.01 | 0.00 | |||
| Total | 38,741 | |||||
| Source[28] | ||||||
| Parties | Vote | |||||
|---|---|---|---|---|---|---|
| Votes | % | + / - | ||||
| Social Democrats | 14,614 | 39.91 | ||||
| Green Left | 6,988 | 19.08 | ||||
| Conservatives | 6,984 | 19.07 | ||||
| Social Liberals | 2,940 | 8.03 | ||||
| Venstre | 2,382 | 6.51 | ||||
| Liberal Centre | 1,786 | 4.88 | ||||
| Communist Party of Denmark | 442 | 1.21 | ||||
| Independent Party | 282 | 0.77 | ||||
| Justice Party of Denmark | 194 | 0.53 | ||||
| Thode Karlsen | 5 | 0.01 | ||||
| Total | 36,617 | |||||
| Source[29] | ||||||
European Parliament elections results
2019 European Parliament election in Denmark
| Parties | Vote | |||||
|---|---|---|---|---|---|---|
| Votes | % | + / - | ||||
| Social Democrats | 7,907 | 26.36 | +2.54 | |||
| Green Left | 4,565 | 15.22 | +3.73 | |||
| Venstre | 4,187 | 13.96 | +4.39 | |||
| Danish People's Party | 3,404 | 11.35 | -18.21 | |||
| Social Liberals | 2,956 | 9.85 | +3.93 | |||
| Red–Green Alliance | 2,335 | 7.78 | New | |||
| Conservatives | 1,759 | 5.86 | -1.28 | |||
| People's Movement against the EU | 1,506 | 5.02 | -5.33 | |||
| The Alternative | 929 | 3.10 | New | |||
| Liberal Alliance | 451 | 1.50 | -0.67 | |||
| Total | 29,999 | |||||
| Source[30] | ||||||
2014 European Parliament election in Denmark
| Parties | Vote | |||||
|---|---|---|---|---|---|---|
| Votes | % | + / - | ||||
| Danish People's Party | 7,611 | 29.56 | +11.08 | |||
| Social Democrats | 6,131 | 23.82 | -1.71 | |||
| Green Left | 2,957 | 11.49 | -6.17 | |||
| People's Movement against the EU | 2,664 | 10.35 | -0.30 | |||
| Venstre | 2,463 | 9.57 | -2.23 | |||
| Conservatives | 1,837 | 7.14 | -2.48 | |||
| Social Liberals | 1,523 | 5.92 | +2.41 | |||
| Liberal Alliance | 558 | 2.17 | +1.69 | |||
| Total | 25,744 | |||||
| Source[31] | ||||||
2009 European Parliament election in Denmark
| Parties | Vote | |||||
|---|---|---|---|---|---|---|
| Votes | % | + / - | ||||
| Social Democrats | 6,730 | 25.53 | -12.79 | |||
| Danish People's Party | 4,873 | 18.48 | +9.99 | |||
| Green Left | 4,656 | 17.66 | +7.99 | |||
| Venstre | 3,111 | 11.80 | +2.34 | |||
| People's Movement against the EU | 2,808 | 10.65 | +3.06 | |||
| Conservatives | 2,536 | 9.62 | -1.19 | |||
| Social Liberals | 926 | 3.51 | -1.22 | |||
| June Movement | 599 | 2.27 | -7.61 | |||
| Liberal Alliance | 127 | 0.48 | New | |||
| Total | 26,366 | |||||
| Source[32] | ||||||
2004 European Parliament election in Denmark
| Parties | Vote | |||||
|---|---|---|---|---|---|---|
| Votes | % | + / - | ||||
| Social Democrats | 8,557 | 38.32 | +18.97 | |||
| Conservatives | 2,415 | 10.81 | +2.94 | |||
| June Movement | 2,206 | 9.88 | -8.88 | |||
| Green Left | 2,159 | 9.67 | -0.15 | |||
| Venstre | 2,113 | 9.46 | -3.57 | |||
| Danish People's Party | 1,895 | 8.49 | +0.43 | |||
| People's Movement against the EU | 1,695 | 7.59 | -2.43 | |||
| Social Liberals | 1,056 | 4.73 | -3.48 | |||
| Christian Democrats | 236 | 1.06 | -0.48 | |||
| Total | 22,332 | |||||
| Source[33] | ||||||
1999 European Parliament election in Denmark
| Parties | Vote | |||||
|---|---|---|---|---|---|---|
| Votes | % | + / - | ||||
| Social Democrats | 4,726 | 19.35 | +1.45 | |||
| June Movement | 4,581 | 18.76 | +0.53 | |||
| Venstre | 3,181 | 13.03 | +4.11 | |||
| People's Movement against the EU | 2,446 | 10.02 | -3.85 | |||
| Green Left | 2,399 | 9.82 | -1.52 | |||
| Social Liberals | 2,006 | 8.21 | -1.08 | |||
| Danish People's Party | 1,969 | 8.06 | New | |||
| Conservatives | 1,922 | 7.87 | -7.91 | |||
| Centre Democrats | 815 | 3.34 | +2.32 | |||
| Christian Democrats | 376 | 1.54 | +0.62 | |||
| Progress Party | 115 | 0.47 | -2.27 | |||
| Total | 24,421 | |||||
| Source[34] | ||||||
1994 European Parliament election in Denmark
| Parties | Vote | |||||
|---|---|---|---|---|---|---|
| Votes | % | + / - | ||||
| June Movement | 4,785 | 18.23 | New | |||
| Social Democrats | 4,698 | 17.90 | -8.37 | |||
| Conservatives | 4,144 | 15.78 | +4.43 | |||
| People's Movement against the EU | 3,642 | 13.87 | -14.81 | |||
| Green Left | 2,977 | 11.34 | -0.31 | |||
| Social Liberals | 2,439 | 9.29 | +7.07 | |||
| Venstre | 2,341 | 8.92 | +2.16 | |||
| Progress Party | 719 | 2.74 | -1.07 | |||
| Centre Democrats | 267 | 1.02 | -6.35 | |||
| Christian Democrats | 241 | 0.92 | -0.98 | |||
| Total | 26,253 | |||||
| Source[35] | ||||||
1989 European Parliament election in Denmark
| Parties | Vote | |||||
|---|---|---|---|---|---|---|
| Votes | % | + / - | ||||
| People's Movement against the EU | 6,855 | 28.68 | -0.51 | |||
| Social Democrats | 6,280 | 26.27 | +3.84 | |||
| Green Left | 2,785 | 11.65 | -2.95 | |||
| Conservatives | 2,714 | 11.35 | -6.18 | |||
| Centre Democrats | 1,761 | 7.37 | +2.04 | |||
| Venstre | 1,617 | 6.76 | +4.31 | |||
| Progress Party | 910 | 3.81 | +0.64 | |||
| Social Liberals | 530 | 2.22 | -0.30 | |||
| Christian Democrats | 453 | 1.90 | +0.16 | |||
| Total | 23,905 | |||||
| Source[36] | ||||||
1984 European Parliament election in Denmark
| Parties | Vote | |||||
|---|---|---|---|---|---|---|
| Votes | % | |||||
| People's Movement against the EU | 7,831 | 29.19 | ||||
| Social Democrats | 6,018 | 22.43 | ||||
| Conservatives | 4,703 | 17.53 | ||||
| Green Left | 3,916 | 14.60 | ||||
| Centre Democrats | 1,429 | 5.33 | ||||
| Progress Party | 851 | 3.17 | ||||
| Social Liberals | 675 | 2.52 | ||||
| Venstre | 658 | 2.45 | ||||
| Christian Democrats | 468 | 1.74 | ||||
| Left Socialists | 281 | 1.05 | ||||
| Total | 26,830 | |||||
| Source[37] | ||||||
Referendums
2022 Danish European Union opt-out referendum[38]
| Option | Votes | % |
|---|---|---|
| ✓ YES | 18,978 | 64.37 |
| X NO | 10,506 | 35.63 |
2015 Danish European Union opt-out referendum[39]
| Option | Votes | % |
|---|---|---|
| X NO | 16,312 | 57.94 |
| ✓ YES | 11,840 | 42.06 |
2014 Danish Unified Patent Court membership referendum[40]
| Option | Votes | % |
|---|---|---|
| ✓ YES | 14,329 | 57.08 |
| X NO | 10,774 | 42.92 |
2009 Danish Act of Succession referendum[41]
| Option | Votes | % |
|---|---|---|
| ✓ YES | 20,055 | 83.23 |
| X NO | 4,040 | 16.77 |
2000 Danish euro referendum[42]
| Option | Votes | % |
|---|---|---|
| X NO | 24,383 | 59.39 |
| ✓ YES | 16,672 | 40.61 |
1998 Danish Amsterdam Treaty referendum[43]
| Option | Votes | % |
|---|---|---|
| X NO | 18,941 | 52.76 |
| ✓ YES | 16,959 | 47.24 |
1993 Danish Maastricht Treaty referendum[44]
| Option | Votes | % |
|---|---|---|
| X NO | 21,230 | 50.71 |
| ✓ YES | 20,632 | 49.29 |
1992 Danish Maastricht Treaty referendum[45]
| Option | Votes | % |
|---|---|---|
| X NO | 23,694 | 58.24 |
| ✓ YES | 16,991 | 41.76 |
1986 Danish Single European Act referendum[46]
| Option | Votes | % |
|---|---|---|
| X NO | 22,108 | 58.94 |
| ✓ YES | 15,400 | 41.06 |
1972 Danish European Communities membership referendum[47]
| Option | Votes | % |
|---|---|---|
| ✓ YES | 22,363 | 53.92 |
| X NO | 19,115 | 46.08 |
References
- "Rødovrekredsen". kmdvalg.dk (in Danish). Retrieved 2023-06-08.
- "Forslag til Lov om ændring af lov om valg til folketinget". Folketingstidende. 16 December 1965.
- "Nye valgkredse fordeler stemmerne anderledes". dr.dk (in Danish). Retrieved 2023-06-08.
- "Beretning om nye valgkredse som følge af kommunalreformen" (in Danish). Retrieved 2023-06-08.
- "Det danske valgsystem: Valg til Folketinget". valg.im (in Danish). Retrieved 2023-06-08.
- "16 Rødovre". dataforsyningen.dk (in Danish). Retrieved 2023-06-08.
- "Forslag til Lov om ændring af lov om valg til folketinget". Folketingstidende. 16 December 1965.
- "Valgresultater fra tidligere valg:". kmdvalg (in Danish). Retrieved 2023-06-08.
- "FOLKETINGSVALG TIRSDAG 1. NOVEMBER 2022". valg.im (in Danish). Retrieved 2023-06-27.
- "FOLKETINGSVALG ONSDAG 5. JUNI 2019". valg.im (in Danish). Retrieved 2023-06-27.
- "FOLKETINGSVALG TORSDAG 18. JUNI 2015". valg.im (in Danish). Retrieved 2023-06-27.
- "FOLKETINGSVALG TORSDAG 15. SEPTEMBER 2011". valg.im (in Danish). Retrieved 2023-06-27.
- "Folketingsvalget den 13. november 2007". valg.im (in Danish). Retrieved 2023-06-27.
- "valg2005.book" (PDF). valg.im (in Danish). Retrieved 2023-06-27.
- "BMTABEL" (PDF). valg.im (in Danish). Retrieved 2023-06-27.
- "VALG98" (PDF). valg.im (in Danish). Retrieved 2023-06-27.
- "VALG94" (PDF). valg.im (in Danish). Retrieved 2023-06-27.
- "VALG90" (PDF). valg.im (in Danish). Retrieved 2023-06-27.
- "Folketingsvalget den 10. maj 1988". valg.im (in Danish). Retrieved 2023-06-27.
- "Folketingsvalget den 8.september 1987". dst.dk (in Danish). Retrieved 2023-06-27.
- "Folketingsvalget den 10. januar 1984". dst.dk (in Danish). Retrieved 2023-06-27.
- "Folketingsvalget den 8. december 1981". dst.dk (in Danish). Retrieved 2023-06-27.
- "Folketingsvalget den 23. oktober 1979". dst.dk (in Danish). Retrieved 2023-06-27.
- "Folketingsvalget den 15. februar 1977". dst.dk (in Danish). Retrieved 2023-06-27.
- "Folketingsvalget den 9. januar 1975". dst.dk (in Danish). Retrieved 2023-06-27.
- "Folketingsvalget den 4. december 1973". dst.dk (in Danish). Retrieved 2023-06-27.
- "Folketingsvalget den 21. september 1971 samt folkeafstemningen". dst.dk (in Danish). Retrieved 2023-06-27.
- "Folketingsvalget den 23. januar 1968". dst.dk (in Danish). Retrieved 2023-06-27.
- "Folketingsvalget den 22. november 1966". dst.dk (in Danish). Retrieved 2023-06-27.
- "EUROPA-PARLAMENTSVALG SØNDAG 26. MAJ 2019". dst.dk (in Danish). Retrieved 2023-07-01.
- "EUROPA-PARLAMENTSVALG SØNDAG 25. MAJ 2014". dst.dk (in Danish). Retrieved 2023-07-01.
- "EUROPA-PARLAMENTSVALG SØNDAG 7. JUNI 2009". dst.dk (in Danish). Retrieved 2023-07-01.
- "EUROPA-PARLAMENTSVALGET DEN 13. JUNI 2004" (PDF). im.dk (in Danish). Retrieved 2023-07-01.
- "VALGET TIL EUROPA-PARLAMENTET DEN 10. JUNI 1999" (PDF). im.dk (in Danish). Retrieved 2023-07-01.
- "VALGET TIL EUROPA-PARLAMENTET DEN 9. JUNI 1994" (PDF). im.dk (in Danish). Retrieved 2023-07-01.
- "Valget til Europa-parlamentet den 15. juni 1989". dst.dk (in Danish). Retrieved 2023-07-01.
- "Valget til Europa-Parlamentet den 14. juni 1984". dst.dk (in Danish). Retrieved 2023-07-01.
- "FOLKEAFSTEMNING ONSDAG 1. JUNI 2022". dst.dk (in Danish). Retrieved 2023-07-05.
- "FOLKEAFSTEMNING TORSDAG 3. DECEMBER 2015". dst.dk (in Danish). Retrieved 2023-07-05.
- "FOLKEAFSTEMNING SØNDAG 25. MAJ 2014". dst.dk (in Danish). Retrieved 2023-07-05.
- "FOLKEAFSTEMNING SØNDAG 7. JUNI 2009". dst.dk (in Danish). Retrieved 2023-07-05.
- "FOLKEAFSTEMNINGEN DEN 28. SEPTEMBER 2000 OM DANMARKS DELTAGELSE I DEN FÆLLES VALUTA" (PDF). valg.im (in Danish). Retrieved 2023-07-05.
- "FOLKEAFSTEMNINGEN DEN 28. MAJ 1998OM DANMARKS TILTRÆDELSE AF AMSTERDAMTRAKTATEN" (PDF). valg.im (in Danish). Retrieved 2023-07-05.
- "FOLKEAFSTEMNINGEN DEN 18. MAJ 1993 OM DANMARKS TILTRÆDELSE AF EDINBURGH-AFGØRELSEN OG MAASTRICHT-TRAKTATEN". dst.dk (in Danish). Retrieved 2023-07-05.
- "Folkeafstemningen den 1. juni 1992 om Danmarks tiltrædelse af traktaten om Den Europæiske Union". dst.dk (in Danish). Retrieved 2023-07-05.
- "Vejledende folkeafstemning torsdag den 27. februar 1986 om Danmarks tiltrædelse af EF- pakken". dst.dk (in Danish). Retrieved 2023-07-05.
- "Folkeafstemningen om Danmarks tiltrædelse af De europæiske Fælleskaber 2. oktober 1972". dst.dk (in Danish). Retrieved 2023-07-05.