West Renfrewshire (UK Parliament constituency)
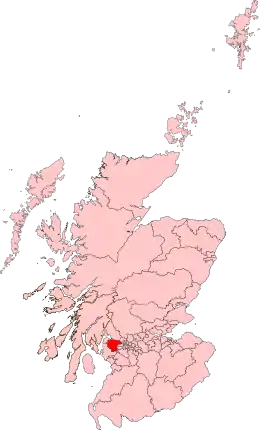
West Renfrewshire was a county constituency of the House of Commons of the Parliament of the United Kingdom from 1885 to 1983 and again from 1997 until 2005. In 2005 the constituency was abolished and the area is now represented by Inverclyde, Paisley and Renfrewshire North and Paisley and Renfrewshire South.
| West Renfrewshire | |
|---|---|
| Former County constituency for the House of Commons | |
 Boundary of West Renfrewshire in Scotland for the 2001 general election | |
| Subdivisions of Scotland | Renfrewshire |
| 1997–2005 | |
| Seats | One |
| Replaced by | Inverclyde Paisley & Renfrewshire North Paisley & Renfrewshire South |
| 1885–1983 | |
| Seats | One |
| Created from | Renfrewshire |
| Replaced by | Renfrew West & Inverclyde Paisley North Paisley South |
Boundaries
The Redistribution of Seats Act 1885 provided that the Western division should consist of "the parishes of Inverkip, Greenock, Port Glasgow, Kilmalcolm, Erskine, Inchinnan, Houston, Kilbarchan, Lochwinnoch, Renfrew, Abbey, Neilston, Beith, and Dunlop".[1]
From 1918 the constituency consisted of "The Lower county District, inclusive of all burghs situated therein, except the burgh of Greenock, together with the burgh of Johnstone."
From 1997 to 2005 the constituency consisted of the Renfrew District electoral divisions of Bargarran and Gryffe, and the Inverclyde District electoral division of Port Glasgow and Kilmacolm.
In 1999 with the creation of the devolved Scottish Parliament, a Scottish Parliamentary constituency of West Renfrewshire was created with the same name and boundaries as the UK Parliament constituency.
Abolition
Under the Parliamentary Constituencies (Scotland) Order 1983 (SI 1983/422), made under the authority of the House of Commons (Redistribution of Seats) Act 1949, West Renfrewshire was abolished in 1983. The area of the constituency was divided between Renfrew West and Inverclyde, Paisley North and Paisley South.
In 2005, the constituency was again abolished and remains so to the present day. The Parliamentary Constituencies (Scotland) Order 2005 (SI 2005/250) made under the authority of the Parliamentary Constituencies Act 1986 divided the former West Renfrewshire constituency amongst the new Inverclyde, Paisley and Renfrewshire North and Paisley and Renfrewshire South constituencies.
Members of Parliament
MPs 1885–1983
Constituency divided amongst:
MPs 1997–2005
| Election | Member[2] | Party | |
|---|---|---|---|
| 1997 | Tommy Graham | Labour then Independent | |
| 2001 | Jim Sheridan | Labour | |
| 2005 | constituency abolished | ||
Constituency divided amongst:
Election results
Elections in the 1880s
| Party | Candidate | Votes | % | ±% | |
|---|---|---|---|---|---|
| Conservative | Archibald Campbell | 3,618 | 54.8 | ||
| Liberal | Harry Smith | 2,980 | 45.2 | ||
| Majority | 638 | 9.6 | |||
| Turnout | 6,598 | 85.1 | |||
| Registered electors | 7,750 | ||||
| Conservative win (new seat) | |||||
| Party | Candidate | Votes | % | ±% | |
|---|---|---|---|---|---|
| Conservative | Archibald Campbell | 3,434 | 54.4 | −0.4 | |
| Liberal | William Dunn | 2,881 | 45.6 | +0.4 | |
| Majority | 553 | 8.8 | −0.8 | ||
| Turnout | 6,315 | 81.5 | −3.6 | ||
| Registered electors | 7,750 | ||||
| Conservative hold | Swing | −0.4 | |||
Elections in the 1890s

| Party | Candidate | Votes | % | ±% | |
|---|---|---|---|---|---|
| Conservative | Charles Renshaw | 3,773 | 53.2 | −1.2 | |
| Liberal | Robert Wallace | 3,322 | 46.8 | +1.2 | |
| Majority | 451 | 6.4 | −2.4 | ||
| Turnout | 7,095 | 86.6 | +5.1 | ||
| Registered electors | 8,192 | ||||
| Conservative hold | Swing | −1.2 | |||
| Party | Candidate | Votes | % | ±% | |
|---|---|---|---|---|---|
| Conservative | Charles Renshaw | 3,909 | 54.2 | +1.0 | |
| Liberal | Duncan Pirie | 3,306 | 45.8 | −1.0 | |
| Majority | 603 | 8.4 | +2.0 | ||
| Turnout | 7,215 | 86.0 | −0.6 | ||
| Registered electors | 8,386 | ||||
| Conservative hold | Swing | +1.0 | |||
Elections in the 1900s
| Party | Candidate | Votes | % | ±% | |
|---|---|---|---|---|---|
| Conservative | Charles Renshaw | 4,323 | 51.6 | −2.6 | |
| Liberal | Thomas Glen-Coats | 4,053 | 48.4 | +2.6 | |
| Majority | 270 | 3.2 | −5.2 | ||
| Turnout | 8,376 | 84.9 | −1.1 | ||
| Registered electors | 9,861 | ||||
| Conservative hold | Swing | −2.6 | |||
| Party | Candidate | Votes | % | ±% | |
|---|---|---|---|---|---|
| Liberal | Thomas Glen-Coats | 5,858 | 56.6 | +8.2 | |
| Conservative | John Charles Cunninghame | 4,490 | 43.4 | −8.2 | |
| Majority | 1,368 | 13.2 | N/A | ||
| Turnout | 10,348 | 85.7 | +0.8 | ||
| Registered electors | 12,079 | ||||
| Liberal gain from Conservative | Swing | +8.2 | |||
Elections in the 1910s
| Party | Candidate | Votes | % | ±% | |
|---|---|---|---|---|---|
| Liberal | James Greig | 6,480 | 53.5 | −3.1 | |
| Conservative | John Charles Cuninghame | 5,631 | 46.5 | +3.1 | |
| Majority | 849 | 7.0 | −6.2 | ||
| Turnout | 12,111 | 87.1 | +1.4 | ||
| Registered electors | 13,900 | ||||
| Liberal hold | Swing | −3.1 | |||
| Party | Candidate | Votes | % | ±% | |
|---|---|---|---|---|---|
| Liberal | James Greig | 6,366 | 51.1 | −2.4 | |
| Conservative | Henry Mechan | 6,082 | 48.9 | +2.4 | |
| Majority | 284 | 2.2 | −4.8 | ||
| Turnout | 12,448 | 86.7 | −0.4 | ||
| Registered electors | 14,363 | ||||
| Liberal hold | Swing | −2.4 | |||
General Election 1914–15:
Another General Election was required to take place before the end of 1915. The political parties had been making preparations for an election to take place and by the July 1914, the following candidates had been selected;
- Liberal: James Greig
- Unionist: Henry Mechan[11]

| Party | Candidate | Votes | % | ±% | |
|---|---|---|---|---|---|
| C | Liberal | James Greig | 11,524 | 61.8 | +10.7 |
| Labour | Robert Murray | 7,126 | 38.2 | New | |
| Majority | 4,398 | 23.6 | +21.4 | ||
| Turnout | 18,650 | 65.3 | −21.4 | ||
| Registered electors | 28,542 | ||||
| Liberal hold | Swing | N/A | |||
| C indicates candidate endorsed by the coalition government. | |||||
Elections in the 1920s
| Party | Candidate | Votes | % | ±% | |
|---|---|---|---|---|---|
| Labour | Robert Murray | 11,787 | 54.0 | +15.8 | |
| National Liberal | James Greig | 10,051 | 46.0 | −15.8 | |
| Majority | 1,736 | 8.0 | N/A | ||
| Turnout | 21,838 | 75.6 | +10.3 | ||
| Registered electors | 28,868 | ||||
| Labour gain from Liberal | Swing | +15.8 | |||
| Party | Candidate | Votes | % | ±% | |
|---|---|---|---|---|---|
| Labour | Robert Murray | 10,904 | 48.1 | −5.9 | |
| Unionist | Alexander Thomson Taylor | 7,602 | 33.6 | New | |
| Liberal | James Scott | 4,149 | 18.3 | −27.7 | |
| Majority | 3,302 | 14.5 | +6.5 | ||
| Turnout | 22,655 | 77.0 | +1.4 | ||
| Registered electors | 29,426 | ||||
| Labour hold | Swing | +10.9 | |||
| Party | Candidate | Votes | % | ±% | |
|---|---|---|---|---|---|
| Unionist | McInnes Shaw | 13,267 | 54.1 | +20.5 | |
| Labour | Robert Murray | 11,252 | 45.9 | −2.2 | |
| Majority | 2,015 | 8.2 | N/A | ||
| Turnout | 24,519 | 84.5 | +7.5 | ||
| Registered electors | 29,029 | ||||
| Unionist gain from Labour | Swing | +9.2 | |||
| Party | Candidate | Votes | % | ±% | |
|---|---|---|---|---|---|
| Labour | Robert Forgan | 14,419 | 46.5 | +0.6 | |
| Unionist | Alexander Thomson Taylor | 12,183 | 39.4 | −14.7 | |
| Liberal | Francis Anderson | 2,682 | 8.7 | New | |
| National (Scotland) | Roland Muirhead | 1,667 | 5.4 | New | |
| Majority | 2,236 | 7.1 | N/A | ||
| Turnout | 30,951 | 81.6 | −2.9 | ||
| Registered electors | 37,947 | ||||
| Labour gain from Unionist | Swing | +7.7 | |||
Elections in the 1930s
| Party | Candidate | Votes | % | ±% | |
|---|---|---|---|---|---|
| Unionist | Henry Scrymgeour-Wedderburn | 17,318 | 53.5 | +14.1 | |
| Ind. Labour Party | Jean Mann | 10,203 | 31.5 | New | |
| National (Scotland) | Roland Muirhead | 3,547 | 11.0 | +5.6 | |
| New Party | Robert Forgan | 1,304 | 4.0 | New | |
| Majority | 7,115 | 22.0 | +14.9 | ||
| Turnout | 32,372 | 83.2 | +1.6 | ||
| Unionist gain from Labour | Swing | ||||
| Party | Candidate | Votes | % | ±% | |
|---|---|---|---|---|---|
| Unionist | Henry Scrymgeour-Wedderburn | 15,906 | 49.7 | -3.8 | |
| Labour | Jean Mann | 12,407 | 38.8 | N/A | |
| SNP | Roland Muirhead | 3,697 | 11.5 | +0.5 | |
| Majority | 3,499 | 10.9 | -11.1 | ||
| Turnout | 32,010 | 81.2 | -2.0 | ||
| Unionist hold | Swing | ||||
Elections in the 1940s
General Election 1939–40
Another General Election was required to take place before the end of 1940. The political parties had been making preparations for an election to take place and by the Autumn of 1939, the following candidates had been selected;
- Unionist: Henry Scrymgeour-Wedderburn
- Labour: David Cleghorn Thomson[20]
- SNP:
| Party | Candidate | Votes | % | ±% | |
|---|---|---|---|---|---|
| Labour | Thomas Scollan | 15,050 | 48.9 | +10.1 | |
| Unionist | Henry Scrymgeour-Wedderburn | 13,836 | 44.9 | -4.8 | |
| SNP | Robert Blair Wilkie | 1,955 | 6.3 | -5.2 | |
| Majority | 1,214 | 4.0 | N/A | ||
| Turnout | 30,841 | 70.0 | -11.2 | ||
| Labour gain from Unionist | Swing | +7.4 | |||
Elections in the 1950s
| Party | Candidate | Votes | % | ±% | |
|---|---|---|---|---|---|
| National Liberal | John Maclay | 20,810 | 54.03 | ||
| Labour | Thomas Scollan | 17,708 | 45.97 | ||
| Majority | 3,102 | 8.06 | N/A | ||
| Turnout | 38,518 | 77.42 | |||
| National Liberal gain from Labour | Swing | ||||
| Party | Candidate | Votes | % | ±% | |
|---|---|---|---|---|---|
| National Liberal | John Maclay | 21,456 | 53.71 | ||
| Labour | Bruce Millan | 18,493 | 46.29 | ||
| Majority | 2,963 | 7.42 | |||
| Turnout | 39,949 | 84.66 | |||
| National Liberal hold | Swing | ||||
| Party | Candidate | Votes | % | ±% | |
|---|---|---|---|---|---|
| National Liberal | John Maclay | 21,283 | 55.24 | ||
| Labour Co-op | Dickson Mabon | 17,243 | 44.76 | ||
| Majority | 4,040 | 10.48 | |||
| Turnout | 38,526 | 83.02 | |||
| National Liberal hold | Swing | ||||
| Party | Candidate | Votes | % | ±% | |
|---|---|---|---|---|---|
| National Liberal | John Maclay | 20,959 | 53.51 | ||
| Labour | Charles Minihan | 18,206 | 46.49 | ||
| Majority | 2,753 | 7.02 | |||
| Turnout | 39,165 | 82.64 | |||
| National Liberal hold | Swing | ||||
Elections in the 1960s
| Party | Candidate | Votes | % | ±% | |
|---|---|---|---|---|---|
| Labour | Norman Buchan | 19,518 | 46.17 | ||
| Unionist | Roy Pickering Paton | 18,507 | 43.77 | ||
| Liberal | Gavin E McFadyean | 4,253 | 10.06 | New | |
| Majority | 1,011 | 2.40 | N/A | ||
| Turnout | 42,278 | 82.87 | |||
| Labour gain from National Liberal | Swing | ||||
| Party | Candidate | Votes | % | ±% | |
|---|---|---|---|---|---|
| Labour | Norman Buchan | 23,849 | 54.31 | ||
| Conservative | Roy Pickering Paton | 20,060 | 45.69 | ||
| Majority | 3,789 | 8.62 | |||
| Turnout | 43,909 | 81.62 | |||
| Labour hold | Swing | ||||
Elections in the 1970s
| Party | Candidate | Votes | % | ±% | |
|---|---|---|---|---|---|
| Labour | Norman Buchan | 22,999 | 48.02 | ||
| Conservative | Alexander Fletcher | 20,699 | 43.22 | ||
| SNP | Allan Macartney | 4,195 | 8.76 | New | |
| Majority | 2,300 | 4.80 | |||
| Turnout | 47,893 | 79.41 | |||
| Labour hold | Swing | ||||
| Party | Candidate | Votes | % | ±% | |
|---|---|---|---|---|---|
| Labour | Norman Buchan | 22,178 | 40.25 | ||
| Conservative | J. Ross-Harper | 19,510 | 35.41 | ||
| SNP | Charles Cameron | 8,394 | 15.23 | ||
| Liberal | David Young | 5,022 | 9.11 | New | |
| Majority | 2,668 | 4.84 | |||
| Turnout | 55,104 | 82.92 | |||
| Labour hold | Swing | ||||
| Party | Candidate | Votes | % | ±% | |
|---|---|---|---|---|---|
| Labour | Norman Buchan | 20,674 | 38.49 | ||
| SNP | Charles Cameron | 15,374 | 28.62 | ||
| Conservative | J. Ross-Harper | 14,399 | 26.80 | ||
| Liberal | D Brown | 3,271 | 6.09 | ||
| Majority | 5,300 | 9.87 | |||
| Turnout | 53,718 | 80.08 | |||
| Labour hold | Swing | ||||
| Party | Candidate | Votes | % | ±% | |
|---|---|---|---|---|---|
| Labour | Norman Buchan | 28,236 | 44.47 | +5.98 | |
| Conservative | W Boyle | 19,664 | 30.97 | +4.17 | |
| SNP | Charles Cameron | 8,333 | 13.13 | -15.49 | |
| Liberal | Ross Finnie | 7,256 | 11.43 | +5.34 | |
| Majority | 8,572 | 13.50 | +4.37 | ||
| Turnout | 63,489 | 81.17 | +1.09 | ||
| Labour hold | Swing | ||||
Elections in the 1990s
| Party | Candidate | Votes | % | ±% | |
|---|---|---|---|---|---|
| Labour | Tommy Graham | 19,525 | 46.6 | +3.7 | |
| SNP | Colin Campbell | 10,546 | 26.5 | +5.9 | |
| Conservative | Charles J.S. Cormack | 7,387 | 18.6 | -9.2 | |
| Liberal Democrats | Bruce J.S. Macpherson | 3,045 | 7.7 | -0.8 | |
| Referendum | Shaw T. Lindsay | 283 | 0.7 | New | |
| Majority | 7,979 | 20.1 | |||
| Turnout | 39,786 | 76.0 | |||
| Labour win (new seat) | |||||
Elections in the 2000s
| Party | Candidate | Votes | % | ±% | |
|---|---|---|---|---|---|
| Labour | Jim Sheridan | 15,720 | 46.9 | +0.3 | |
| SNP | Carol Puthucheary | 7,145 | 21.3 | −5.2 | |
| Conservative | David Sharpe | 5,522 | 16.5 | −2.1 | |
| Liberal Democrats | Clare Hamblen | 4,185 | 12.5 | +4.8 | |
| Scottish Socialist | Arlene Nunnery | 925 | 2.8 | New | |
| Majority | 8,575 | 25.6 | +5.5 | ||
| Turnout | 33,497 | 63.3 | −12.7 | ||
| Labour hold | Swing | ||||
References
- Redistribution of Seats Act 1885, Seventh Schedule, Part II
- Leigh Rayment's Historical List of MPs – Constituencies beginning with "R" (part 1)
- "Obituary: Viscount Muirshiel". Independent.co.uk. 20 August 1992.
- "WHISP 49/3". Archived from the original on 24 April 2010.
- Debrett's House of Commons and Judicial Bench, 1889
- Craig, FWS, ed. (1974). British Parliamentary Election Results: 1885–1918. London: Macmillan Press. ISBN 9781349022984.
- Whitaker's Almanack, 1893
- Debrett's House of Commons and the Judicial Bench, 1901
- Whitaker's Almanack, 1907
- Debrett's House of Commons and the Judicial Bench, 1916
- Daily Record 26 December 1914
- Whitaker's Almanack, 1920
- The Times, 17 November 1922
- The Times, 8 December 1923
- Oliver & Boyd's Edinburgh Almanac, 1927
- The Times, 1 June 1929
- Whitaker's Almanack, 1934
- Craig, F.W.S., ed. (1969). British parliamentary election results 1918–1949. Glasgow: Political Reference Publications. p. 645. ISBN 0-900178-01-9.
- Whitaker's Almanack, 1939
- Report of the Annual Conference of the Labour Party, 1939
- "Election Data 1997". Electoral Calculus. Archived from the original on 15 October 2011. Retrieved 28 June 2017.
- "Election Data 2001". Electoral Calculus. Archived from the original on 15 October 2011. Retrieved 28 June 2017.