Ringkøbing (nomination district)
Ringkøbing nominating district is one of the 92 nominating districts that was created for Danish elections following the 2007 municipal reform.[3][4][5] It consists of Ringkøbing-Skjern municipality.[6] It was created in 1849[7] as a constituency, and has been a nomination district since 1920, though its boundaries have been changed since then.
| Ringkøbing | |
|---|---|
| Ringkøbing | |
| Nomination district constituency for the Folketing | |
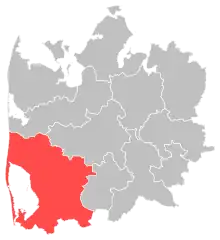 Location of Ringkøbing within West Jutland | |
 Location of West Jutland within Denmark | |
| Municipalities | Ringkøbing-Skjern |
| Constituency | West Jutland |
| Electorate | 40,312 (2022)[1] |
| Current constituency | |
| Created | 1849 (as constituency)[2] 1920 (as nomination district) |
In general elections, the district is a very strong area for parties commonly associated with the blue bloc, and in the 2022 election, it became the district where they received their highest vote share.[8]
General elections results
General elections in the 2020s
| Parties | Vote | |||||
|---|---|---|---|---|---|---|
| Votes | % | + / - | ||||
| Venstre | 8,492 | 24.95 | -6.67 | |||
| Social Democrats | 7,095 | 20.85 | +1.43 | |||
| Denmark Democrats | 5,681 | 16.69 | New | |||
| Liberal Alliance | 2,404 | 7.06 | +5.26 | |||
| Moderates | 2,178 | 6.40 | New | |||
| Conservatives | 2,140 | 6.29 | +0.28 | |||
| Green Left | 1,578 | 4.64 | +0.02 | |||
| Christian Democrats | 1,421 | 4.18 | -12.20 | |||
| New Right | 1,205 | 3.54 | +1.98 | |||
| Danish People's Party | 615 | 1.81 | -8.04 | |||
| Red–Green Alliance | 452 | 1.33 | -0.88 | |||
| Social Liberals | 385 | 1.13 | -2.38 | |||
| The Alternative | 320 | 0.94 | -0.21 | |||
| Independent Greens | 40 | 0.12 | New | |||
| Karen Predbjørn Klarbæk | 27 | 0.08 | New | |||
| Total | 34,033 | |||||
| Source[9] | ||||||
General elections in the 2010s
| Parties | Vote | |||||
|---|---|---|---|---|---|---|
| Votes | % | + / - | ||||
| Venstre | 10,858 | 31.62 | -3.05 | |||
| Social Democrats | 6,668 | 19.42 | +0.22 | |||
| Christian Democrats | 5,624 | 16.38 | +9.89 | |||
| Danish People's Party | 3,383 | 9.85 | -12.60 | |||
| Conservatives | 2,063 | 6.01 | +2.96 | |||
| Green Left | 1,586 | 4.62 | +1.79 | |||
| Social Liberals | 1,207 | 3.51 | +1.60 | |||
| Red–Green Alliance | 758 | 2.21 | -0.93 | |||
| Liberal Alliance | 619 | 1.80 | -2.78 | |||
| New Right | 536 | 1.56 | New | |||
| Stram Kurs | 477 | 1.39 | New | |||
| The Alternative | 396 | 1.15 | -0.53 | |||
| Klaus Riskær Pedersen Party | 167 | 0.49 | New | |||
| Total | 34,342 | |||||
| Source[10] | ||||||
| Parties | Vote | |||||
|---|---|---|---|---|---|---|
| Votes | % | + / - | ||||
| Venstre | 12,330 | 34.67 | -6.58 | |||
| Danish People's Party | 7,985 | 22.45 | +9.10 | |||
| Social Democrats | 6,830 | 19.20 | +1.75 | |||
| Christian Democrats | 2,309 | 6.49 | +1.36 | |||
| Liberal Alliance | 1,628 | 4.58 | +0.24 | |||
| Red–Green Alliance | 1,118 | 3.14 | +0.86 | |||
| Conservatives | 1,085 | 3.05 | -0.29 | |||
| Green Left | 1,006 | 2.83 | -4.31 | |||
| Social Liberals | 681 | 1.91 | -3.76 | |||
| The Alternative | 596 | 1.68 | New | |||
| Erik Sputnik | 0 | 0.00 | New | |||
| Total | 35,568 | |||||
| Source[11] | ||||||
| Parties | Vote | |||||
|---|---|---|---|---|---|---|
| Votes | % | + / - | ||||
| Venstre | 15,143 | 41.25 | -0.21 | |||
| Social Democrats | 6,406 | 17.45 | +0.27 | |||
| Danish People's Party | 4,900 | 13.35 | -0.22 | |||
| Green Left | 2,622 | 7.14 | -0.71 | |||
| Social Liberals | 2,081 | 5.67 | +2.31 | |||
| Christian Democrats | 1,883 | 5.13 | -1.36 | |||
| Liberal Alliance | 1,592 | 4.34 | +2.46 | |||
| Conservatives | 1,226 | 3.34 | -4.32 | |||
| Red–Green Alliance | 837 | 2.28 | +1.76 | |||
| Rikke Cramer Christiansen | 13 | 0.04 | New | |||
| Ejgil Kølbæk | 3 | 0.01 | -0.01 | |||
| Total | 36,706 | |||||
| Source[12] | ||||||
General elections in the 2000s
| Parties | Vote | |||||
|---|---|---|---|---|---|---|
| Votes | % | + / - | ||||
| Venstre | 15,089 | 41.46 | -1.52 | |||
| Social Democrats | 6,254 | 17.18 | -0.70 | |||
| Danish People's Party | 4,939 | 13.57 | +1.00 | |||
| Green Left | 2,858 | 7.85 | +1.72 | |||
| Conservatives | 2,789 | 7.66 | +0.84 | |||
| Christian Democrats | 2,363 | 6.49 | +1.23 | |||
| Social Liberals | 1,222 | 3.36 | -2.46 | |||
| New Alliance | 683 | 1.88 | New | |||
| Red–Green Alliance | 190 | 0.52 | -0.95 | |||
| Ejgil Kølbæk | 8 | 0.02 | 0.00 | |||
| Total | 36,395 | |||||
| Source[13] | ||||||
| Parties | Vote | |||||
|---|---|---|---|---|---|---|
| Votes | % | + / - | ||||
| Venstre | 16,658 | 42.98 | -1.58 | |||
| Social Democrats | 6,931 | 17.88 | -3.47 | |||
| Danish People's Party | 4,871 | 12.57 | +1.47 | |||
| Conservatives | 2,644 | 6.82 | +1.10 | |||
| Green Left | 2,377 | 6.13 | +0.63 | |||
| Social Liberals | 2,255 | 5.82 | +2.35 | |||
| Christian Democrats | 2,039 | 5.26 | -0.39 | |||
| Red–Green Alliance | 568 | 1.47 | +0.78 | |||
| Centre Democrats | 362 | 0.93 | -0.38 | |||
| Minority Party | 47 | 0.12 | New | |||
| Ejgil Kølbæk | 9 | 0.02 | New | |||
| Total | 38,761 | |||||
| Source[14] | ||||||
| Parties | Vote | |||||
|---|---|---|---|---|---|---|
| Votes | % | + / - | ||||
| Venstre | 17,932 | 44.56 | +7.33 | |||
| Social Democrats | 8,590 | 21.35 | -4.55 | |||
| Danish People's Party | 4,468 | 11.10 | +4.02 | |||
| Conservatives | 2,301 | 5.72 | -0.54 | |||
| Christian People's Party | 2,273 | 5.65 | -1.67 | |||
| Green Left | 2,214 | 5.50 | -0.90 | |||
| Social Liberals | 1,395 | 3.47 | +0.60 | |||
| Centre Democrats | 529 | 1.31 | -2.42 | |||
| Red–Green Alliance | 279 | 0.69 | -0.14 | |||
| Progress Party | 260 | 0.65 | -1.39 | |||
| Total | 40,241 | |||||
| Source[15] | ||||||
General elections in the 1990s
| Parties | Vote | |||||
|---|---|---|---|---|---|---|
| Votes | % | + / - | ||||
| Venstre | 15,002 | 37.23 | -1.58 | |||
| Social Democrats | 10,435 | 25.90 | +1.52 | |||
| Christian People's Party | 2,949 | 7.32 | +2.29 | |||
| Danish People's Party | 2,853 | 7.08 | New | |||
| Green Left | 2,579 | 6.40 | +0.38 | |||
| Conservatives | 2,521 | 6.26 | -5.72 | |||
| Centre Democrats | 1,503 | 3.73 | +1.63 | |||
| Social Liberals | 1,157 | 2.87 | -0.07 | |||
| Progress Party | 820 | 2.04 | -5.77 | |||
| Red–Green Alliance | 333 | 0.83 | -0.11 | |||
| Democratic Renewal | 140 | 0.35 | New | |||
| Total | 40,292 | |||||
| Source[16] | ||||||
| Parties | Vote | |||||
|---|---|---|---|---|---|---|
| Votes | % | + / - | ||||
| Venstre | 15,541 | 38.81 | +10.00 | |||
| Social Democrats | 9,763 | 24.38 | +0.06 | |||
| Conservatives | 4,796 | 11.98 | -1.84 | |||
| Progress Party | 3,126 | 7.81 | -2.18 | |||
| Green Left | 2,410 | 6.02 | +0.34 | |||
| Christian People's Party | 2,014 | 5.03 | -1.92 | |||
| Social Liberals | 1,179 | 2.94 | +0.18 | |||
| Centre Democrats | 840 | 2.10 | -3.25 | |||
| Red–Green Alliance | 377 | 0.94 | +0.50 | |||
| Total | 40,046 | |||||
| Source[17] | ||||||
| Parties | Vote | |||||
|---|---|---|---|---|---|---|
| Votes | % | + / - | ||||
| Venstre | 11,142 | 28.81 | +2.14 | |||
| Social Democrats | 9,403 | 24.32 | +4.43 | |||
| Conservatives | 5,346 | 13.82 | -2.39 | |||
| Progress Party | 3,862 | 9.99 | -2.29 | |||
| Christian People's Party | 2,689 | 6.95 | +0.58 | |||
| Green Left | 2,197 | 5.68 | +0.25 | |||
| Centre Democrats | 2,068 | 5.35 | -1.34 | |||
| Social Liberals | 1,066 | 2.76 | -1.24 | |||
| Common Course | 391 | 1.01 | -0.17 | |||
| Red–Green Alliance | 171 | 0.44 | New | |||
| The Greens | 169 | 0.44 | -0.38 | |||
| Justice Party of Denmark | 167 | 0.43 | New | |||
| Total | 38,671 | |||||
| Source[18] | ||||||
General elections in the 1980s
| Parties | Vote | |||||
|---|---|---|---|---|---|---|
| Votes | % | + / - | ||||
| Venstre | 10,609 | 26.67 | +0.65 | |||
| Social Democrats | 7,915 | 19.89 | -1.14 | |||
| Conservatives | 6,449 | 16.21 | -2.20 | |||
| Progress Party | 4,884 | 12.28 | +6.08 | |||
| Centre Democrats | 2,663 | 6.69 | -0.22 | |||
| Christian People's Party | 2,534 | 6.37 | -0.87 | |||
| Green Left | 2,161 | 5.43 | -0.83 | |||
| Social Liberals | 1,592 | 4.00 | -0.28 | |||
| Common Course | 470 | 1.18 | -0.14 | |||
| The Greens | 328 | 0.82 | +0.05 | |||
| Communist Party of Denmark | 85 | 0.21 | +0.19 | |||
| Left Socialists | 77 | 0.19 | -0.26 | |||
| Kaj Ove Sørensen | 17 | 0.04 | New | |||
| Total | 39,784 | |||||
| Source[19] | ||||||
| Parties | Vote | |||||
|---|---|---|---|---|---|---|
| Votes | % | + / - | ||||
| Venstre | 10,479 | 26.02 | -1.08 | |||
| Social Democrats | 8,470 | 21.03 | +1.50 | |||
| Conservatives | 7,414 | 18.41 | -4.05 | |||
| Christian People's Party | 2,916 | 7.24 | -1.09 | |||
| Centre Democrats | 2,785 | 6.91 | +1.00 | |||
| Green Left | 2,521 | 6.26 | +1.56 | |||
| Progress Party | 2,496 | 6.20 | +0.38 | |||
| Social Liberals | 1,722 | 4.28 | +0.30 | |||
| Common Course | 533 | 1.32 | New | |||
| The Greens | 309 | 0.77 | New | |||
| Justice Party of Denmark | 190 | 0.47 | -0.60 | |||
| Left Socialists | 181 | 0.45 | -0.45 | |||
| Socialist Workers Party | 105 | 0.26 | +0.24 | |||
| Erik Haaest | 72 | 0.18 | New | |||
| Humanist Party | 60 | 0.15 | New | |||
| Communist Party of Denmark | 10 | 0.02 | -0.14 | |||
| Marxist–Leninists Party | 10 | 0.02 | +0.01 | |||
| Ian Jordan | 3 | 0.01 | New | |||
| Total | 40,276 | |||||
| Source[20] | ||||||
| Parties | Vote | |||||
|---|---|---|---|---|---|---|
| Votes | % | + / - | ||||
| Venstre | 10,979 | 27.10 | +1.75 | |||
| Conservatives | 9,100 | 22.46 | +10.40 | |||
| Social Democrats | 7,910 | 19.53 | -1.61 | |||
| Christian People's Party | 3,373 | 8.33 | +1.49 | |||
| Centre Democrats | 2,396 | 5.91 | -3.19 | |||
| Progress Party | 2,358 | 5.82 | -8.88 | |||
| Green Left | 1,902 | 4.70 | -0.19 | |||
| Social Liberals | 1,613 | 3.98 | +0.20 | |||
| Justice Party of Denmark | 434 | 1.07 | -0.06 | |||
| Left Socialists | 364 | 0.90 | +0.19 | |||
| Communist Party of Denmark | 64 | 0.16 | -0.07 | |||
| Socialist Workers Party | 10 | 0.02 | 0.00 | |||
| Marxist–Leninists Party | 6 | 0.01 | New | |||
| Total | 40,509 | |||||
| Source[21] | ||||||
| Parties | Vote | |||||
|---|---|---|---|---|---|---|
| Votes | % | + / - | ||||
| Venstre | 9,458 | 25.35 | -1.94 | |||
| Social Democrats | 7,889 | 21.14 | -2.99 | |||
| Progress Party | 5,487 | 14.70 | -1.81 | |||
| Conservatives | 4,502 | 12.06 | +1.88 | |||
| Centre Democrats | 3,395 | 9.10 | +5.45 | |||
| Christian People's Party | 2,552 | 6.84 | -0.21 | |||
| Green Left | 1,826 | 4.89 | +2.22 | |||
| Social Liberals | 1,412 | 3.78 | -0.58 | |||
| Justice Party of Denmark | 420 | 1.13 | -0.90 | |||
| Left Socialists | 264 | 0.71 | -0.64 | |||
| Communist Party of Denmark | 84 | 0.23 | -0.34 | |||
| Communist Workers Party | 19 | 0.05 | -0.15 | |||
| Socialist Workers Party | 7 | 0.02 | New | |||
| Total | 37,315 | |||||
| Source[22] | ||||||
General elections in the 1970s
| Parties | Vote | |||||
|---|---|---|---|---|---|---|
| Votes | % | + / - | ||||
| Venstre | 10,329 | 27.29 | -0.61 | |||
| Social Democrats | 9,132 | 24.13 | +2.74 | |||
| Progress Party | 6,250 | 16.51 | -4.20 | |||
| Conservatives | 3,851 | 10.18 | +3.91 | |||
| Christian People's Party | 2,670 | 7.05 | -1.18 | |||
| Social Liberals | 1,651 | 4.36 | +1.15 | |||
| Centre Democrats | 1,383 | 3.65 | -2.01 | |||
| Green Left | 1,012 | 2.67 | +1.00 | |||
| Justice Party of Denmark | 769 | 2.03 | -0.54 | |||
| Left Socialists | 511 | 1.35 | +0.56 | |||
| Communist Party of Denmark | 215 | 0.57 | -0.45 | |||
| Communist Workers Party | 74 | 0.20 | New | |||
| Total | 37,847 | |||||
| Source[23] | ||||||
| Parties | Vote | |||||
|---|---|---|---|---|---|---|
| Votes | % | + / - | ||||
| Venstre | 9,944 | 27.90 | -13.19 | |||
| Social Democrats | 7,626 | 21.39 | +5.67 | |||
| Progress Party | 7,381 | 20.71 | +4.98 | |||
| Christian People's Party | 2,935 | 8.23 | -2.67 | |||
| Conservatives | 2,235 | 6.27 | +2.51 | |||
| Centre Democrats | 2,018 | 5.66 | +4.14 | |||
| Social Liberals | 1,144 | 3.21 | -2.49 | |||
| Justice Party of Denmark | 915 | 2.57 | +0.86 | |||
| Green Left | 597 | 1.67 | +0.04 | |||
| Communist Party of Denmark | 364 | 1.02 | -0.06 | |||
| Left Socialists | 280 | 0.79 | -0.39 | |||
| Pensioners' Party | 208 | 0.58 | New | |||
| Total | 35,647 | |||||
| Source[24] | ||||||
| Parties | Vote | |||||
|---|---|---|---|---|---|---|
| Votes | % | + / - | ||||
| Venstre | 14,384 | 41.09 | +13.11 | |||
| Progress Party | 5,505 | 15.73 | -3.39 | |||
| Social Democrats | 5,502 | 15.72 | +1.77 | |||
| Christian People's Party | 3,817 | 10.90 | +1.64 | |||
| Social Liberals | 1,994 | 5.70 | -6.54 | |||
| Conservatives | 1,316 | 3.76 | -2.81 | |||
| Justice Party of Denmark | 598 | 1.71 | -0.90 | |||
| Green Left | 570 | 1.63 | -0.41 | |||
| Centre Democrats | 531 | 1.52 | -3.06 | |||
| Left Socialists | 412 | 1.18 | +0.46 | |||
| Communist Party of Denmark | 378 | 1.08 | +0.15 | |||
| Total | 35,007 | |||||
| Source[25] | ||||||
| Parties | Vote | |||||
|---|---|---|---|---|---|---|
| Votes | % | + / - | ||||
| Venstre | 9,691 | 27.98 | -10.96 | |||
| Progress Party | 6,622 | 19.12 | New | |||
| Social Democrats | 4,831 | 13.95 | -9.21 | |||
| Social Liberals | 4,240 | 12.24 | -3.13 | |||
| Christian People's Party | 3,207 | 9.26 | +4.50 | |||
| Conservatives | 2,277 | 6.57 | -5.13 | |||
| Centre Democrats | 1,588 | 4.58 | New | |||
| Justice Party of Denmark | 903 | 2.61 | +0.50 | |||
| Green Left | 706 | 2.04 | -0.96 | |||
| Communist Party of Denmark | 322 | 0.93 | +0.50 | |||
| Left Socialists | 249 | 0.72 | +0.19 | |||
| Total | 34,636 | |||||
| Source[26] | ||||||
| Parties | Vote | |||||
|---|---|---|---|---|---|---|
| Votes | % | + / - | ||||
| Venstre | 12,560 | 38.94 | -15.53 | |||
| Social Democrats | 7,471 | 23.16 | +3.65 | |||
| Social Liberals | 4,956 | 15.37 | +5.06 | |||
| Conservatives | 3,772 | 11.70 | +1.56 | |||
| Christian People's Party | 1,535 | 4.76 | New | |||
| Green Left | 969 | 3.00 | +1.28 | |||
| Justice Party of Denmark | 681 | 2.11 | +0.75 | |||
| Left Socialists | 170 | 0.53 | +0.05 | |||
| Communist Party of Denmark | 139 | 0.43 | +0.32 | |||
| Total | 32,253 | |||||
| Source[27] | ||||||
General elections in the 1960s
| Parties | Vote | |||||
|---|---|---|---|---|---|---|
| Votes | % | + / - | ||||
| Venstre | 7,907 | 54.47 | +2.23 | |||
| Social Democrats | 2,832 | 19.51 | -4.88 | |||
| Social Liberals | 1,497 | 10.31 | +4.98 | |||
| Conservatives | 1,472 | 10.14 | +0.13 | |||
| Green Left | 250 | 1.72 | -1.21 | |||
| Justice Party of Denmark | 197 | 1.36 | 0.00 | |||
| Independent Party | 152 | 1.05 | -1.15 | |||
| Liberal Centre | 123 | 0.85 | -0.58 | |||
| Left Socialists | 69 | 0.48 | New | |||
| Communist Party of Denmark | 16 | 0.11 | 0.00 | |||
| Total | 14,515 | |||||
| Source[28] | ||||||
| Parties | Vote | |||||
|---|---|---|---|---|---|---|
| Votes | % | + / - | ||||
| Venstre | 7,360 | 52.24 | -1.26 | |||
| Social Democrats | 3,436 | 24.39 | -0.07 | |||
| Conservatives | 1,410 | 10.01 | -0.20 | |||
| Social Liberals | 751 | 5.33 | +1.20 | |||
| Green Left | 413 | 2.93 | +1.72 | |||
| Independent Party | 310 | 2.20 | -0.75 | |||
| Liberal Centre | 202 | 1.43 | New | |||
| Justice Party of Denmark | 192 | 1.36 | -1.19 | |||
| Communist Party of Denmark | 16 | 0.11 | -0.07 | |||
| Total | 14,090 | |||||
| Source[29] | ||||||
| Parties | Vote | |||||
|---|---|---|---|---|---|---|
| Votes | % | + / - | ||||
| Venstre | 7,121 | 53.50 | -1.65 | |||
| Social Democrats | 3,256 | 24.46 | +1.53 | |||
| Conservatives | 1,359 | 10.21 | +3.23 | |||
| Social Liberals | 550 | 4.13 | -0.19 | |||
| Independent Party | 393 | 2.95 | -2.53 | |||
| Justice Party of Denmark | 340 | 2.55 | -0.92 | |||
| Green Left | 161 | 1.21 | -0.03 | |||
| Danish Unity | 66 | 0.50 | New | |||
| Peace Politics People's Party | 40 | 0.30 | New | |||
| Communist Party of Denmark | 24 | 0.18 | +0.06 | |||
| Total | 13,310 | |||||
| Source[30] | ||||||
| Parties | Vote | |||||
|---|---|---|---|---|---|---|
| Votes | % | + / - | ||||
| Venstre | 6,799 | 55.15 | -6.29 | |||
| Social Democrats | 2,827 | 22.93 | +4.38 | |||
| Conservatives | 861 | 6.98 | +2.01 | |||
| Independent Party | 676 | 5.48 | +1.46 | |||
| Social Liberals | 532 | 4.32 | -0.24 | |||
| Justice Party of Denmark | 428 | 3.47 | -2.63 | |||
| Green Left | 153 | 1.24 | New | |||
| Jon Galster | 37 | 0.30 | New | |||
| Communist Party of Denmark | 15 | 0.12 | -0.23 | |||
| Total | 12,328 | |||||
| Source[31] | ||||||
General elections in the 1950s
| Parties | Vote | |||||
|---|---|---|---|---|---|---|
| Votes | % | + / - | ||||
| Venstre | 7,273 | 61.44 | +2.94 | |||
| Social Democrats | 2,196 | 18.55 | -2.54 | |||
| Justice Party of Denmark | 722 | 6.10 | +1.59 | |||
| Conservatives | 588 | 4.97 | +0.51 | |||
| Social Liberals | 540 | 4.56 | +0.15 | |||
| Independent Party | 476 | 4.02 | -2.43 | |||
| Communist Party of Denmark | 42 | 0.35 | -0.23 | |||
| Total | 11,837 | |||||
| Source[32] | ||||||
September 1953 Danish Folketing election
| Parties | Vote | |||||
|---|---|---|---|---|---|---|
| Votes | % | + / - | ||||
| Venstre | 6,739 | 58.50 | -1.39 | |||
| Social Democrats | 2,430 | 21.09 | +0.65 | |||
| Independent Party | 743 | 6.45 | New | |||
| Justice Party of Denmark | 519 | 4.51 | -3.11 | |||
| Conservatives | 514 | 4.46 | -1.13 | |||
| Social Liberals | 508 | 4.41 | -0.50 | |||
| Communist Party of Denmark | 67 | 0.58 | -0.15 | |||
| Total | 11,520 | |||||
| Source[33] | ||||||
April 1953 Danish Folketing election
| Parties | Vote | |||||
|---|---|---|---|---|---|---|
| Votes | % | + / - | ||||
| Venstre | 6,171 | 59.89 | -0.85 | |||
| Social Democrats | 2,106 | 20.44 | +1.46 | |||
| Justice Party of Denmark | 785 | 7.62 | -1.66 | |||
| Conservatives | 576 | 5.59 | -0.19 | |||
| Social Liberals | 506 | 4.91 | +0.38 | |||
| Danish Unity | 85 | 0.82 | New | |||
| Communist Party of Denmark | 75 | 0.73 | +0.04 | |||
| Total | 10,304 | |||||
| Source[34] | ||||||
1950 Danish Folketing election
| Parties | Vote | |||||
|---|---|---|---|---|---|---|
| Votes | % | + / - | ||||
| Venstre | 6,680 | 60.74 | -5.08 | |||
| Social Democrats | 2,087 | 18.98 | +0.62 | |||
| Justice Party of Denmark | 1,021 | 9.28 | +4.17 | |||
| Conservatives | 636 | 5.78 | +2.04 | |||
| Social Liberals | 498 | 4.53 | +0.34 | |||
| Communist Party of Denmark | 76 | 0.69 | -0.48 | |||
| Total | 10,998 | |||||
| Source[35] | ||||||
General elections in the 1940s
1947 Danish Folketing election
| Parties | Vote | |||||
|---|---|---|---|---|---|---|
| Votes | % | + / - | ||||
| Venstre | 7,392 | 65.82 | +2.37 | |||
| Social Democrats | 2,062 | 18.36 | +1.63 | |||
| Justice Party of Denmark | 574 | 5.11 | +2.63 | |||
| Social Liberals | 471 | 4.19 | -2.43 | |||
| Conservatives | 420 | 3.74 | -1.19 | |||
| Danish Unity | 180 | 1.60 | -1.87 | |||
| Communist Party of Denmark | 131 | 1.17 | -1.15 | |||
| Total | 11,230 | |||||
| Source[36] | ||||||
1945 Danish Folketing election
| Parties | Vote | |||||
|---|---|---|---|---|---|---|
| Votes | % | + / - | ||||
| Venstre | 6,961 | 63.45 | +3.10 | |||
| Social Democrats | 1,835 | 16.73 | -3.24 | |||
| Social Liberals | 726 | 6.62 | +0.98 | |||
| Conservatives | 541 | 4.93 | -1.46 | |||
| Danish Unity | 381 | 3.47 | +2.83 | |||
| Justice Party of Denmark | 272 | 2.48 | -0.16 | |||
| Communist Party of Denmark | 255 | 2.32 | New | |||
| Total | 10,971 | |||||
| Source[37] | ||||||
1943 Danish Folketing election
| Parties | Vote | |||||
|---|---|---|---|---|---|---|
| Votes | % | + / - | ||||
| Venstre | 6,539 | 60.35 | +2.37 | |||
| Social Democrats | 2,164 | 19.97 | +5.21 | |||
| Conservatives | 692 | 6.39 | -0.16 | |||
| Social Liberals | 611 | 5.64 | -1.48 | |||
| Justice Party of Denmark | 286 | 2.64 | -0.69 | |||
| Farmers' Party | 237 | 2.19 | -5.36 | |||
| National Socialist Workers' Party of Denmark | 237 | 2.19 | +1.09 | |||
| Danish Unity | 69 | 0.64 | -0.23 | |||
| Total | 10,835 | |||||
| Source[38] | ||||||
General elections in the 1930s
1939 Danish Folketing election
| Parties | Vote | |||||
|---|---|---|---|---|---|---|
| Votes | % | + / - | ||||
| Venstre | 5,252 | 57.98 | +0.85 | |||
| Social Democrats | 1,337 | 14.76 | -2.12 | |||
| Farmers' Party | 684 | 7.55 | -0.87 | |||
| Social Liberals | 645 | 7.12 | +0.43 | |||
| Conservatives | 593 | 6.55 | -0.54 | |||
| Justice Party of Denmark | 302 | 3.33 | +0.65 | |||
| National Socialist Workers' Party of Denmark | 100 | 1.10 | +0.56 | |||
| Danish Unity | 79 | 0.87 | New | |||
| Communist Party of Denmark | 36 | 0.40 | -0.17 | |||
| National Cooperation | 31 | 0.34 | New | |||
| Total | 9,059 | |||||
| Source[39] | ||||||
1935 Danish Folketing election
| Parties | Vote | |||||
|---|---|---|---|---|---|---|
| Votes | % | + / - | ||||
| Venstre | 5,218 | 57.13 | -13.16 | |||
| Social Democrats | 1,542 | 16.88 | +2.27 | |||
| Independent People's Party | 769 | 8.42 | New | |||
| Conservatives | 648 | 7.09 | +1.80 | |||
| Social Liberals | 611 | 6.69 | -0.24 | |||
| Justice Party of Denmark | 245 | 2.68 | -0.19 | |||
| Communist Party of Denmark | 52 | 0.57 | New | |||
| National Socialist Workers' Party of Denmark | 49 | 0.54 | New | |||
| Total | 9,134 | |||||
| Source[40] | ||||||
1932 Danish Folketing election
| Parties | Vote | |||||
|---|---|---|---|---|---|---|
| Votes | % | + / - | ||||
| Venstre | 6,360 | 70.29 | -3.35 | |||
| Social Democrats | 1,322 | 14.61 | +1.37 | |||
| Social Liberals | 627 | 6.93 | -0.68 | |||
| Conservatives | 479 | 5.29 | +1.04 | |||
| Justice Party of Denmark | 260 | 2.87 | +1.60 | |||
| Total | 9,048 | |||||
| Source[41] | ||||||
General elections in the 1920s
1929 Danish Folketing election
| Parties | Vote | |||||
|---|---|---|---|---|---|---|
| Votes | % | + / - | ||||
| Venstre | 6,396 | 73.64 | -2.53 | |||
| Social Democrats | 1,150 | 13.24 | +2.15 | |||
| Social Liberals | 661 | 7.61 | +0.52 | |||
| Conservatives | 369 | 4.25 | -0.57 | |||
| Justice Party of Denmark | 110 | 1.27 | +0.45 | |||
| Total | 8,686 | |||||
| Source[42] | ||||||
1926 Danish Folketing election
| Parties | Vote | |||||
|---|---|---|---|---|---|---|
| Votes | % | + / - | ||||
| Venstre | 6,206 | 76.17 | -0.68 | |||
| Social Democrats | 904 | 11.09 | +0.22 | |||
| Social Liberals | 578 | 7.09 | +0.27 | |||
| Conservatives | 393 | 4.82 | +0.50 | |||
| Justice Party of Denmark | 67 | 0.82 | -0.07 | |||
| Total | 8,148 | |||||
| Source[43] | ||||||
1924 Danish Folketing election
| Parties | Vote | |||||
|---|---|---|---|---|---|---|
| Votes | % | + / - | ||||
| Venstre | 6,292 | 76.85 | -7.00 | |||
| Social Democrats | 890 | 10.87 | +2.44 | |||
| Social Liberals | 558 | 6.82 | +1.44 | |||
| Conservatives | 354 | 4.32 | +2.21 | |||
| Justice Party of Denmark | 73 | 0.89 | New | |||
| Farmer Party | 20 | 0.24 | New | |||
| Total | 8,187 | |||||
| Source[44] | ||||||
September 1920 Danish Folketing election
| Parties | Vote | |||||
|---|---|---|---|---|---|---|
| Votes | % | + / - | ||||
| Venstre | 6,762 | 83.85 | -2.74 | |||
| Social Democrats | 680 | 8.43 | +1.54 | |||
| Social Liberals | 434 | 5.38 | +1.20 | |||
| Conservatives | 170 | 2.11 | -0.03 | |||
| Industry Party | 18 | 0.22 | +0.02 | |||
| Total | 8,064 | |||||
| Source[45] | ||||||
July 1920 Danish Folketing election
| Parties | Vote | |||||
|---|---|---|---|---|---|---|
| Votes | % | + / - | ||||
| Venstre | 5,946 | 86.59 | +1.09 | |||
| Social Democrats | 473 | 6.89 | +0.32 | |||
| Social Liberals | 287 | 4.18 | -1.00 | |||
| Conservatives | 147 | 2.14 | -0.61 | |||
| Industry Party | 14 | 0.20 | New | |||
| Total | 6,867 | |||||
| Source[46] | ||||||
April 1920 Danish Folketing election
| Parties | Vote | |||||
|---|---|---|---|---|---|---|
| Votes | % | |||||
| Venstre | 5,996 | 85.50 | ||||
| Social Democrats | 461 | 6.57 | ||||
| Social Liberals | 363 | 5.18 | ||||
| Conservatives | 193 | 2.75 | ||||
| Total | 7,013 | |||||
| Source[47] | ||||||
European Parliament elections results
2019 European Parliament election in Denmark
| Parties | Vote | |||||
|---|---|---|---|---|---|---|
| Votes | % | + / - | ||||
| Venstre | 11,720 | 44.64 | +11.97 | |||
| Social Democrats | 4,462 | 17.00 | +3.95 | |||
| Danish People's Party | 2,849 | 10.85 | -16.26 | |||
| Green Left | 1,883 | 7.17 | +1.49 | |||
| Conservatives | 1,722 | 6.56 | -4.91 | |||
| Social Liberals | 1,481 | 5.64 | +2.07 | |||
| People's Movement against the EU | 726 | 2.77 | -1.56 | |||
| Red–Green Alliance | 544 | 2.07 | New | |||
| Liberal Alliance | 520 | 1.98 | -0.14 | |||
| The Alternative | 346 | 1.32 | New | |||
| Total | 26,253 | |||||
| Source[48] | ||||||
2014 European Parliament election in Denmark
| Parties | Vote | |||||
|---|---|---|---|---|---|---|
| Votes | % | + / - | ||||
| Venstre | 7,497 | 32.67 | -1.80 | |||
| Danish People's Party | 6,221 | 27.11 | +13.20 | |||
| Social Democrats | 2,994 | 13.05 | -1.25 | |||
| Conservatives | 2,632 | 11.47 | -7.74 | |||
| Green Left | 1,303 | 5.68 | -4.28 | |||
| People's Movement against the EU | 993 | 4.33 | +0.54 | |||
| Social Liberals | 819 | 3.57 | +1.21 | |||
| Liberal Alliance | 486 | 2.12 | +1.71 | |||
| Total | 22,945 | |||||
| Source[49] | ||||||
2009 European Parliament election in Denmark
| Parties | Vote | |||||
|---|---|---|---|---|---|---|
| Votes | % | + / - | ||||
| Venstre | 8,560 | 34.47 | -1.18 | |||
| Conservatives | 4,770 | 19.21 | +11.44 | |||
| Social Democrats | 3,551 | 14.30 | -12.98 | |||
| Danish People's Party | 3,454 | 13.91 | +8.39 | |||
| Green Left | 2,473 | 9.96 | +5.31 | |||
| People's Movement against the EU | 941 | 3.79 | +0.49 | |||
| Social Liberals | 587 | 2.36 | -1.82 | |||
| June Movement | 397 | 1.60 | -5.14 | |||
| Liberal Alliance | 103 | 0.41 | New | |||
| Total | 24,836 | |||||
| Source[50] | ||||||
2004 European Parliament election in Denmark
| Parties | Vote | |||||
|---|---|---|---|---|---|---|
| Votes | % | + / - | ||||
| Venstre | 7,610 | 35.65 | -2.81 | |||
| Social Democrats | 5,823 | 27.28 | +16.08 | |||
| Conservatives | 1,658 | 7.77 | +0.66 | |||
| June Movement | 1,439 | 6.74 | -5.99 | |||
| Danish People's Party | 1,179 | 5.52 | +1.09 | |||
| Christian Democrats | 1,045 | 4.90 | -1.19 | |||
| Green Left | 993 | 4.65 | -1.20 | |||
| Social Liberals | 893 | 4.18 | -2.47 | |||
| People's Movement against the EU | 704 | 3.30 | -1.41 | |||
| Total | 21,344 | |||||
| Source[51] | ||||||
1999 European Parliament election in Denmark
| Parties | Vote | |||||
|---|---|---|---|---|---|---|
| Votes | % | + / - | ||||
| Venstre | 8,199 | 38.46 | +4.97 | |||
| June Movement | 2,713 | 12.73 | +1.00 | |||
| Social Democrats | 2,388 | 11.20 | 0.00 | |||
| Conservatives | 1,515 | 7.11 | -12.41 | |||
| Social Liberals | 1,418 | 6.65 | +0.76 | |||
| Christian Democrats | 1,298 | 6.09 | +2.36 | |||
| Green Left | 1,247 | 5.85 | +1.00 | |||
| People's Movement against the EU | 1,004 | 4.71 | -0.89 | |||
| Danish People's Party | 944 | 4.43 | New | |||
| Centre Democrats | 593 | 2.78 | +2.13 | |||
| Progress Party | 308 | 1.44 | -1.90 | |||
| Total | 21,319 | |||||
| Source[52] | ||||||
1994 European Parliament election in Denmark
| Parties | Vote | |||||
|---|---|---|---|---|---|---|
| Votes | % | + / - | ||||
| Venstre | 7,914 | 33.49 | -1.08 | |||
| Conservatives | 4,612 | 19.52 | +7.04 | |||
| June Movement | 2,771 | 11.73 | New | |||
| Social Democrats | 2,647 | 11.20 | -3.33 | |||
| Social Liberals | 1,391 | 5.89 | +3.68 | |||
| People's Movement against the EU | 1,324 | 5.60 | -3.69 | |||
| Green Left | 1,146 | 4.85 | +0.33 | |||
| Christian Democrats | 881 | 3.73 | -4.52 | |||
| Progress Party | 789 | 3.34 | -2.84 | |||
| Centre Democrats | 153 | 0.65 | -7.31 | |||
| Total | 23,628 | |||||
| Source[53] | ||||||
1989 European Parliament election in Denmark
| Parties | Vote | |||||
|---|---|---|---|---|---|---|
| Votes | % | + / - | ||||
| Venstre | 6,903 | 34.57 | +0.18 | |||
| Social Democrats | 2,902 | 14.53 | +2.90 | |||
| Conservatives | 2,492 | 12.48 | -4.47 | |||
| People's Movement against the EU | 1,855 | 9.29 | -1.64 | |||
| Christian Democrats | 1,647 | 8.25 | +0.60 | |||
| Centre Democrats | 1,590 | 7.96 | -0.32 | |||
| Progress Party | 1,234 | 6.18 | +2.31 | |||
| Green Left | 903 | 4.52 | +1.06 | |||
| Social Liberals | 442 | 2.21 | -0.25 | |||
| Total | 19,968 | |||||
| Source[54] | ||||||
1984 European Parliament election in Denmark
| Parties | Vote | |||||
|---|---|---|---|---|---|---|
| Votes | % | |||||
| Venstre | 8,098 | 34.39 | ||||
| Conservatives | 3,992 | 16.95 | ||||
| Social Democrats | 2,738 | 11.63 | ||||
| People's Movement against the EU | 2,573 | 10.93 | ||||
| Centre Democrats | 1,949 | 8.28 | ||||
| Christian Democrats | 1,801 | 7.65 | ||||
| Progress Party | 911 | 3.87 | ||||
| Green Left | 815 | 3.46 | ||||
| Social Liberals | 580 | 2.46 | ||||
| Left Socialists | 91 | 0.39 | ||||
| Total | 23,548 | |||||
| Source[55] | ||||||
Referendums
2022 Danish European Union opt-out referendum[56]
| Option | Votes | % |
|---|---|---|
| ✓ YES | 17,611 | 65.36 |
| X NO | 9,333 | 34.64 |
2015 Danish European Union opt-out referendum[57]
| Option | Votes | % |
|---|---|---|
| ✓ YES | 14,963 | 50.85 |
| X NO | 14,464 | 49.15 |
2014 Danish Unified Patent Court membership referendum[58]
| Option | Votes | % |
|---|---|---|
| ✓ YES | 14,955 | 67.87 |
| X NO | 7,080 | 32.13 |
2009 Danish Act of Succession referendum[59]
| Option | Votes | % |
|---|---|---|
| ✓ YES | 20,667 | 85.52 |
| X NO | 3,498 | 14.48 |
2000 Danish euro referendum[60]
| Option | Votes | % |
|---|---|---|
| X NO | 20,243 | 50.48 |
| ✓ YES | 19,858 | 49.52 |
1998 Danish Amsterdam Treaty referendum[61]
| Option | Votes | % |
|---|---|---|
| ✓ YES | 20,930 | 60.26 |
| X NO | 13,804 | 39.74 |
1993 Danish Maastricht Treaty referendum[62]
| Option | Votes | % |
|---|---|---|
| ✓ YES | 26,053 | 65.66 |
| X NO | 13,625 | 34.34 |
1992 Danish Maastricht Treaty referendum[63]
| Option | Votes | % |
|---|---|---|
| ✓ YES | 21,488 | 56.92 |
| X NO | 16,260 | 43.08 |
1986 Danish Single European Act referendum[64]
| Option | Votes | % |
|---|---|---|
| ✓ YES | 27,582 | 77.39 |
| X NO | 8,056 | 22.61 |
1972 Danish European Communities membership referendum[65]
| Option | Votes | % |
|---|---|---|
| ✓ YES | 25,897 | 76.25 |
| X NO | 8,068 | 23.75 |
1953 Danish constitutional and electoral age referendum[66]
| Option | Votes | % |
|---|---|---|
| ✓ YES | 5,541 | 78.22 |
| X NO | 1,543 | 21.78 |
| 23 years | 5,316 | 74.19 |
| 21 years | 1,849 | 25.81 |
1939 Danish constitutional referendum[67]
| Option | Votes | % |
|---|---|---|
| ✓ YES | 1,399 | 75.38 |
| X NO | 457 | 24.62 |
References
- "Ringkøbingkredsen". kmdvalg.dk (in Danish). Retrieved 2023-06-04.
- "Beretning om Forhandlingerne paa Rigsdagen". Rigsdagstidende. II: Spalte 3892 ff.
- "Nye valgkredse fordeler stemmerne anderledes". dr.dk (in Danish). Retrieved 2023-06-04.
- "Beretning om nye valgkredse som følge af kommunalreformen" (in Danish). Retrieved 2023-06-04.
- "Det danske valgsystem: Valg til Folketinget". valg.im (in Danish). Retrieved 2023-06-04.
- "83 Ringkøbing". dataforsyningen.dk (in Danish). Retrieved 2023-06-04.
- "Beretning om Forhandlingerne paa Rigsdagen". Rigsdagstidende. II: Spalte 3892 ff.
- "Valgresultater fra tidligere valg:". kmdvalg (in Danish). Retrieved 2023-06-04.
- "FOLKETINGSVALG TIRSDAG 1. NOVEMBER 2022". valg.im (in Danish). Retrieved 2023-06-27.
- "FOLKETINGSVALG ONSDAG 5. JUNI 2019". valg.im (in Danish). Retrieved 2023-06-27.
- "FOLKETINGSVALG TORSDAG 18. JUNI 2015". valg.im (in Danish). Retrieved 2023-06-27.
- "FOLKETINGSVALG TORSDAG 15. SEPTEMBER 2011". valg.im (in Danish). Retrieved 2023-06-27.
- "Folketingsvalget den 13. november 2007". valg.im (in Danish). Retrieved 2023-06-27.
- "valg2005.book" (PDF). valg.im (in Danish). Retrieved 2023-06-27.
- "BMTABEL" (PDF). valg.im (in Danish). Retrieved 2023-06-27.
- "VALG98" (PDF). valg.im (in Danish). Retrieved 2023-06-27.
- "VALG94" (PDF). valg.im (in Danish). Retrieved 2023-06-27.
- "VALG90" (PDF). valg.im (in Danish). Retrieved 2023-06-27.
- "Folketingsvalget den 10. maj 1988". valg.im (in Danish). Retrieved 2023-06-27.
- "Folketingsvalget den 8.september 1987". dst.dk (in Danish). Retrieved 2023-06-27.
- "Folketingsvalget den 10. januar 1984". dst.dk (in Danish). Retrieved 2023-06-27.
- "Folketingsvalget den 8. december 1981". dst.dk (in Danish). Retrieved 2023-06-27.
- "Folketingsvalget den 23. oktober 1979". dst.dk (in Danish). Retrieved 2023-06-27.
- "Folketingsvalget den 15. februar 1977". dst.dk (in Danish). Retrieved 2023-06-27.
- "Folketingsvalget den 9. januar 1975". dst.dk (in Danish). Retrieved 2023-06-27.
- "Folketingsvalget den 4. december 1973". dst.dk (in Danish). Retrieved 2023-06-27.
- "Folketingsvalget den 21. september 1971 samt folkeafstemningen". dst.dk (in Danish). Retrieved 2023-06-27.
- "Folketingsvalget den 23. januar 1968". dst.dk (in Danish). Retrieved 2023-06-27.
- "Folketingsvalget den 22. november 1966". dst.dk (in Danish). Retrieved 2023-06-27.
- "Folketingsvalget den 22. september 1964". dst.dk (in Danish). Retrieved 2023-06-27.
- "Folketingsvalget den 15. november 1960". dst.dk (in Danish). Retrieved 2023-06-27.
- "Folketingsvalget den 14. maj 1957". dst.dk (in Danish). Retrieved 2023-06-27.
- "Folketingsvalget den 22. september 1953". dst.dk (in Danish). Retrieved 2023-06-27.
- "Rigsdagsvalgene og folkeafstemningerne i april og maj 1953". dst.dk (in Danish). Retrieved 2023-06-27.
- "Folketingsvalget den 5. september 1950". dst.dk (in Danish). Retrieved 2023-06-27.
- "Folketingsvalget den 28. oktober 1947". dst.dk (in Danish). Retrieved 2023-06-27.
- "Rigsdagsvalgene i oktober og november 1945". dst.dk (in Danish). Retrieved 2023-06-27.
- "Rigsdagsvalgene i marts og april 1943". dst.dk (in Danish). Retrieved 2023-06-27.
- "Rigsdagsvalgene og Folkeafstemningen i april og maj 1939". dst.dk (in Danish). Retrieved 2023-06-27.
- "Folketingsvalget den 22. oktober 1935". dst.dk (in Danish). Retrieved 2023-06-27.
- "Folketingsvalget den 16. november 1932". dst.dk (in Danish). Retrieved 2023-06-27.
- "Folketingsvalget den 24. april 1929". dst.dk (in Danish). Retrieved 2023-06-27.
- "Folketingsvalget den 2. december 1926". dst.dk (in Danish). Retrieved 2023-06-27.
- "Folketingsvalget den 11. april 1924". dst.dk (in Danish). Retrieved 2023-06-27.
- "Rigsdagsvalgene september-oktober 1920". dst.dk (in Danish). Retrieved 2023-06-27.
- "Rigsdagsvalgene juli-august 1920". dst.dk (in Danish). Retrieved 2023-06-27.
- "Folketingsvalget den 26. april 1920". dst.dk (in Danish). Retrieved 2023-06-27.
- "EUROPA-PARLAMENTSVALG SØNDAG 26. MAJ 2019". dst.dk (in Danish). Retrieved 2023-07-01.
- "EUROPA-PARLAMENTSVALG SØNDAG 25. MAJ 2014". dst.dk (in Danish). Retrieved 2023-07-01.
- "EUROPA-PARLAMENTSVALG SØNDAG 7. JUNI 2009". dst.dk (in Danish). Retrieved 2023-07-01.
- "EUROPA-PARLAMENTSVALGET DEN 13. JUNI 2004" (PDF). im.dk (in Danish). Retrieved 2023-07-01.
- "VALGET TIL EUROPA-PARLAMENTET DEN 10. JUNI 1999" (PDF). im.dk (in Danish). Retrieved 2023-07-01.
- "VALGET TIL EUROPA-PARLAMENTET DEN 9. JUNI 1994" (PDF). im.dk (in Danish). Retrieved 2023-07-01.
- "Valget til Europa-parlamentet den 15. juni 1989". dst.dk (in Danish). Retrieved 2023-07-01.
- "Valget til Europa-Parlamentet den 14. juni 1984". dst.dk (in Danish). Retrieved 2023-07-01.
- "FOLKEAFSTEMNING ONSDAG 1. JUNI 2022". dst.dk (in Danish). Retrieved 2023-07-05.
- "FOLKEAFSTEMNING TORSDAG 3. DECEMBER 2015". dst.dk (in Danish). Retrieved 2023-07-05.
- "FOLKEAFSTEMNING SØNDAG 25. MAJ 2014". dst.dk (in Danish). Retrieved 2023-07-05.
- "FOLKEAFSTEMNING SØNDAG 7. JUNI 2009". dst.dk (in Danish). Retrieved 2023-07-05.
- "FOLKEAFSTEMNINGEN DEN 28. SEPTEMBER 2000 OM DANMARKS DELTAGELSE I DEN FÆLLES VALUTA" (PDF). valg.im (in Danish). Retrieved 2023-07-05.
- "FOLKEAFSTEMNINGEN DEN 28. MAJ 1998OM DANMARKS TILTRÆDELSE AF AMSTERDAMTRAKTATEN" (PDF). valg.im (in Danish). Retrieved 2023-07-05.
- "FOLKEAFSTEMNINGEN DEN 18. MAJ 1993 OM DANMARKS TILTRÆDELSE AF EDINBURGH-AFGØRELSEN OG MAASTRICHT-TRAKTATEN". dst.dk (in Danish). Retrieved 2023-07-05.
- "Folkeafstemningen den 1. juni 1992 om Danmarks tiltrædelse af traktaten om Den Europæiske Union". dst.dk (in Danish). Retrieved 2023-07-05.
- "Vejledende folkeafstemning torsdag den 27. februar 1986 om Danmarks tiltrædelse af EF- pakken". dst.dk (in Danish). Retrieved 2023-07-05.
- "Folkeafstemningen om Danmarks tiltrædelse af De europæiske Fælleskaber 2. oktober 1972". dst.dk (in Danish). Retrieved 2023-07-05.
- "Publikationsfortegnelse vedrørende Folkeafstemninger". dst.dk (in Danish). Retrieved 2023-07-05.
- "Publikationsfortegnelse vedrørende Folkeafstemninger". dst.dk (in Danish). Retrieved 2023-07-05.