Roskilde (nomination district)
Roskilde nominating district is one of the 92 nominating districts that exists for Danish elections following the 2007 municipal reform.[3][4][5] It consists of Roskilde Municipality.[6] It was created in 1849 as a constituency,[7] and has been a nomination district since 1920, though its boundaries have been changed since then.
| Roskilde | |
|---|---|
| Roskilde | |
| Nomination district constituency for the Folketing | |
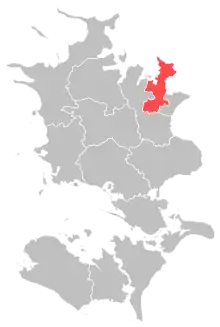 Location of Roskilde within Zealand | |
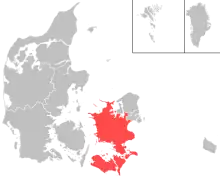 Location of Zealand within Denmark | |
| Municipalities | Roskilde |
| Constituency | Zealand |
| Electorate | 66,179 (2022)[1] |
| Current constituency | |
| Created | 1849 (as constituency)[2] 1920 (as nomination district) |
In general elections, the district tends to vote a bit more for parties commonly associated with the red bloc.[8]
General elections results
General elections in the 2020s
| Parties | Vote | |||||
|---|---|---|---|---|---|---|
| Votes | % | + / - | ||||
| Social Democrats | 14,143 | 24.99 | +1.21 | |||
| Moderates | 7,218 | 12.75 | New | |||
| Green Left | 7,043 | 12.44 | +1.79 | |||
| Venstre | 6,924 | 12.23 | -11.00 | |||
| Liberal Alliance | 4,851 | 8.57 | +6.12 | |||
| Conservatives | 3,036 | 5.36 | -2.08 | |||
| Red–Green Alliance | 2,861 | 5.05 | -1.70 | |||
| Social Liberals | 2,631 | 4.65 | -5.13 | |||
| Denmark Democrats | 2,590 | 4.58 | New | |||
| The Alternative | 1,739 | 3.07 | +0.06 | |||
| New Right | 1,585 | 2.80 | +0.79 | |||
| Danish People's Party | 1,460 | 2.58 | -4.86 | |||
| Independent Greens | 340 | 0.60 | New | |||
| Christian Democrats | 117 | 0.21 | -0.62 | |||
| Lisa Sofia Larsson | 34 | 0.06 | New | |||
| Rasmus Paludan | 30 | 0.05 | New | |||
| Total | 56,602 | |||||
| Source[9] | ||||||
General elections in the 2010s
| Parties | Vote | |||||
|---|---|---|---|---|---|---|
| Votes | % | + / - | ||||
| Social Democrats | 13,225 | 23.78 | -2.22 | |||
| Venstre | 12,923 | 23.23 | +4.15 | |||
| Green Left | 5,924 | 10.65 | +5.26 | |||
| Social Liberals | 5,441 | 9.78 | +3.77 | |||
| Danish People's Party | 4,141 | 7.44 | -11.22 | |||
| Conservatives | 4,136 | 7.44 | +4.16 | |||
| Red–Green Alliance | 3,752 | 6.75 | -0.90 | |||
| The Alternative | 1,675 | 3.01 | -2.23 | |||
| Liberal Alliance | 1,360 | 2.45 | -5.77 | |||
| New Right | 1,116 | 2.01 | New | |||
| Stram Kurs | 937 | 1.68 | New | |||
| Klaus Riskær Pedersen Party | 520 | 0.93 | New | |||
| Christian Democrats | 462 | 0.83 | +0.40 | |||
| Pinki Karin Yvonne Jensen | 10 | 0.02 | New | |||
| Total | 55,622 | |||||
| Source[10] | ||||||
| Parties | Vote | |||||
|---|---|---|---|---|---|---|
| Votes | % | + / - | ||||
| Social Democrats | 14,087 | 26.00 | +4.64 | |||
| Venstre | 10,339 | 19.08 | -6.54 | |||
| Danish People's Party | 10,114 | 18.66 | +6.54 | |||
| Liberal Alliance | 4,456 | 8.22 | +2.37 | |||
| Red–Green Alliance | 4,148 | 7.65 | +0.81 | |||
| Social Liberals | 3,257 | 6.01 | -5.75 | |||
| Green Left | 2,920 | 5.39 | -5.02 | |||
| The Alternative | 2,838 | 5.24 | New | |||
| Conservatives | 1,780 | 3.28 | -2.35 | |||
| Christian Democrats | 234 | 0.43 | +0.05 | |||
| Aamer Ahmad | 13 | 0.02 | New | |||
| Bent A. Jespersen | 3 | 0.01 | +0.01 | |||
| Michael Christiansen | 2 | 0.00 | New | |||
| Total | 54,191 | |||||
| Source[11] | ||||||
| Parties | Vote | |||||
|---|---|---|---|---|---|---|
| Votes | % | + / - | ||||
| Venstre | 13,788 | 25.62 | -0.45 | |||
| Social Democrats | 11,498 | 21.36 | -2.06 | |||
| Danish People's Party | 6,523 | 12.12 | -0.37 | |||
| Social Liberals | 6,327 | 11.76 | +5.58 | |||
| Green Left | 5,605 | 10.41 | -3.57 | |||
| Red–Green Alliance | 3,680 | 6.84 | +4.10 | |||
| Liberal Alliance | 3,149 | 5.85 | +1.97 | |||
| Conservatives | 3,028 | 5.63 | -5.09 | |||
| Christian Democrats | 205 | 0.38 | -0.13 | |||
| Johan Isbrandt Haulik | 12 | 0.02 | New | |||
| Peter Lotinga | 4 | 0.01 | New | |||
| Bent A. Jespersen | 0 | 0.00 | New | |||
| Total | 53,819 | |||||
| Source[12] | ||||||
General elections in the 2000s
| Parties | Vote | |||||
|---|---|---|---|---|---|---|
| Votes | % | + / - | ||||
| Venstre | 13,637 | 26.07 | -2.21 | |||
| Social Democrats | 12,249 | 23.42 | +0.37 | |||
| Green Left | 7,313 | 13.98 | +6.22 | |||
| Danish People's Party | 6,534 | 12.49 | -0.17 | |||
| Conservatives | 5,608 | 10.72 | +0.29 | |||
| Social Liberals | 3,234 | 6.18 | -5.10 | |||
| New Alliance | 2,029 | 3.88 | New | |||
| Red–Green Alliance | 1,434 | 2.74 | -1.28 | |||
| Christian Democrats | 268 | 0.51 | -0.65 | |||
| Total | 52,306 | |||||
| Source[13] | ||||||
| Parties | Vote | |||||
|---|---|---|---|---|---|---|
| Votes | % | + / - | ||||
| Venstre | 12,645 | 28.28 | -2.96 | |||
| Social Democrats | 10,305 | 23.05 | -5.24 | |||
| Danish People's Party | 5,659 | 12.66 | +1.72 | |||
| Social Liberals | 5,046 | 11.28 | +5.38 | |||
| Conservatives | 4,665 | 10.43 | +1.75 | |||
| Green Left | 3,472 | 7.76 | -0.23 | |||
| Red–Green Alliance | 1,796 | 4.02 | +1.05 | |||
| Christian Democrats | 518 | 1.16 | -0.60 | |||
| Centre Democrats | 484 | 1.08 | -0.81 | |||
| Minority Party | 125 | 0.28 | New | |||
| Total | 44,715 | |||||
| Source[14] | ||||||
| Parties | Vote | |||||
|---|---|---|---|---|---|---|
| Votes | % | + / - | ||||
| Venstre | 14,201 | 31.24 | +8.90 | |||
| Social Democrats | 12,858 | 28.29 | -5.42 | |||
| Danish People's Party | 4,974 | 10.94 | +3.46 | |||
| Conservatives | 3,947 | 8.68 | -1.56 | |||
| Green Left | 3,633 | 7.99 | -2.34 | |||
| Social Liberals | 2,680 | 5.90 | +1.39 | |||
| Red–Green Alliance | 1,352 | 2.97 | -0.26 | |||
| Centre Democrats | 859 | 1.89 | -2.89 | |||
| Christian People's Party | 802 | 1.76 | -0.05 | |||
| Progress Party | 149 | 0.33 | -1.00 | |||
| Total | 45,455 | |||||
| Source[15] | ||||||
General elections in the 1990s
| Parties | Vote | |||||
|---|---|---|---|---|---|---|
| Votes | % | + / - | ||||
| Social Democrats | 14,684 | 33.71 | +1.53 | |||
| Venstre | 9,732 | 22.34 | +2.15 | |||
| Green Left | 4,500 | 10.33 | +0.82 | |||
| Conservatives | 4,459 | 10.24 | -7.18 | |||
| Danish People's Party | 3,258 | 7.48 | New | |||
| Centre Democrats | 2,082 | 4.78 | +1.11 | |||
| Social Liberals | 1,964 | 4.51 | -1.80 | |||
| Red–Green Alliance | 1,405 | 3.23 | -0.86 | |||
| Christian People's Party | 788 | 1.81 | +0.38 | |||
| Progress Party | 581 | 1.33 | -3.83 | |||
| Democratic Renewal | 101 | 0.23 | New | |||
| Total | 43,554 | |||||
| Source[16] | ||||||
| Parties | Vote | |||||
|---|---|---|---|---|---|---|
| Votes | % | + / - | ||||
| Social Democrats | 13,655 | 32.18 | -3.46 | |||
| Venstre | 8,567 | 20.19 | +7.58 | |||
| Conservatives | 7,392 | 17.42 | -1.29 | |||
| Green Left | 4,035 | 9.51 | -0.82 | |||
| Social Liberals | 2,679 | 6.31 | +1.75 | |||
| Progress Party | 2,188 | 5.16 | +0.79 | |||
| Red–Green Alliance | 1,734 | 4.09 | +1.53 | |||
| Centre Democrats | 1,558 | 3.67 | -2.70 | |||
| Christian People's Party | 606 | 1.43 | -0.01 | |||
| Anton Strunge | 25 | 0.06 | New | |||
| Total | 42,439 | |||||
| Source[17] | ||||||
| Parties | Vote | |||||
|---|---|---|---|---|---|---|
| Votes | % | + / - | ||||
| Social Democrats | 14,354 | 35.64 | +7.95 | |||
| Conservatives | 7,536 | 18.71 | -3.82 | |||
| Venstre | 5,080 | 12.61 | +4.91 | |||
| Green Left | 4,161 | 10.33 | -5.25 | |||
| Centre Democrats | 2,567 | 6.37 | +1.14 | |||
| Social Liberals | 1,837 | 4.56 | -3.55 | |||
| Progress Party | 1,759 | 4.37 | -2.14 | |||
| Red–Green Alliance | 1,032 | 2.56 | New | |||
| Common Course | 619 | 1.54 | -0.21 | |||
| Christian People's Party | 580 | 1.44 | +0.10 | |||
| The Greens | 507 | 1.26 | -0.30 | |||
| Justice Party of Denmark | 237 | 0.59 | New | |||
| Humanist Party | 11 | 0.03 | New | |||
| Total | 40,280 | |||||
| Source[18] | ||||||
General elections in the 1980s
| Parties | Vote | |||||
|---|---|---|---|---|---|---|
| Votes | % | + / - | ||||
| Social Democrats | 11,209 | 27.69 | +1.01 | |||
| Conservatives | 9,122 | 22.53 | -0.69 | |||
| Green Left | 6,309 | 15.58 | -1.43 | |||
| Social Liberals | 3,284 | 8.11 | -0.22 | |||
| Venstre | 3,116 | 7.70 | +1.35 | |||
| Progress Party | 2,636 | 6.51 | +3.42 | |||
| Centre Democrats | 2,118 | 5.23 | -0.75 | |||
| Common Course | 710 | 1.75 | -0.33 | |||
| The Greens | 632 | 1.56 | +0.09 | |||
| Christian People's Party | 541 | 1.34 | -0.31 | |||
| Left Socialists | 411 | 1.02 | -1.23 | |||
| Communist Party of Denmark | 399 | 0.99 | -0.08 | |||
| Total | 40,487 | |||||
| Source[19] | ||||||
| Parties | Vote | |||||
|---|---|---|---|---|---|---|
| Votes | % | + / - | ||||
| Social Democrats | 10,929 | 26.68 | -3.40 | |||
| Conservatives | 9,513 | 23.22 | -2.82 | |||
| Green Left | 6,967 | 17.01 | +3.28 | |||
| Social Liberals | 3,412 | 8.33 | +0.89 | |||
| Venstre | 2,600 | 6.35 | -1.32 | |||
| Centre Democrats | 2,448 | 5.98 | +1.45 | |||
| Progress Party | 1,266 | 3.09 | +0.69 | |||
| Left Socialists | 921 | 2.25 | -1.29 | |||
| Common Course | 852 | 2.08 | New | |||
| Christian People's Party | 674 | 1.65 | -0.08 | |||
| The Greens | 602 | 1.47 | New | |||
| Communist Party of Denmark | 440 | 1.07 | +0.26 | |||
| Justice Party of Denmark | 229 | 0.56 | -1.27 | |||
| Humanist Party | 50 | 0.12 | New | |||
| Socialist Workers Party | 48 | 0.12 | -0.04 | |||
| Marxist–Leninists Party | 11 | 0.03 | -0.01 | |||
| Total | 40,962 | |||||
| Source[20] | ||||||
| Parties | Vote | |||||
|---|---|---|---|---|---|---|
| Votes | % | + / - | ||||
| Social Democrats | 11,957 | 30.08 | -1.98 | |||
| Conservatives | 10,351 | 26.04 | +8.37 | |||
| Green Left | 5,460 | 13.73 | +1.42 | |||
| Venstre | 3,051 | 7.67 | +0.99 | |||
| Social Liberals | 2,956 | 7.44 | -0.18 | |||
| Centre Democrats | 1,802 | 4.53 | -4.20 | |||
| Left Socialists | 1,407 | 3.54 | +0.28 | |||
| Progress Party | 954 | 2.40 | -4.52 | |||
| Justice Party of Denmark | 729 | 1.83 | +0.22 | |||
| Christian People's Party | 686 | 1.73 | +0.31 | |||
| Communist Party of Denmark | 323 | 0.81 | -0.61 | |||
| Socialist Workers Party | 63 | 0.16 | +0.02 | |||
| Marxist–Leninists Party | 14 | 0.04 | New | |||
| Total | 39,753 | |||||
| Source[21] | ||||||
| Parties | Vote | |||||
|---|---|---|---|---|---|---|
| Votes | % | + / - | ||||
| Social Democrats | 11,594 | 32.06 | -6.73 | |||
| Conservatives | 6,391 | 17.67 | +2.50 | |||
| Green Left | 4,450 | 12.31 | +5.96 | |||
| Centre Democrats | 3,156 | 8.73 | +5.46 | |||
| Social Liberals | 2,754 | 7.62 | -0.47 | |||
| Progress Party | 2,503 | 6.92 | -1.63 | |||
| Venstre | 2,417 | 6.68 | -1.44 | |||
| Left Socialists | 1,180 | 3.26 | -1.25 | |||
| Justice Party of Denmark | 584 | 1.61 | -1.12 | |||
| Communist Party of Denmark | 515 | 1.42 | -0.98 | |||
| Christian People's Party | 515 | 1.42 | -0.16 | |||
| Socialist Workers Party | 52 | 0.14 | New | |||
| Communist Workers Party | 52 | 0.14 | -0.23 | |||
| Total | 36,163 | |||||
| Source[22] | ||||||
General elections in the 1970s
| Parties | Vote | |||||
|---|---|---|---|---|---|---|
| Votes | % | + / - | ||||
| Social Democrats | 14,202 | 38.79 | -0.50 | |||
| Conservatives | 5,555 | 15.17 | +5.35 | |||
| Progress Party | 3,132 | 8.55 | -3.76 | |||
| Venstre | 2,972 | 8.12 | +0.49 | |||
| Social Liberals | 2,963 | 8.09 | +3.10 | |||
| Green Left | 2,326 | 6.35 | +2.09 | |||
| Left Socialists | 1,652 | 4.51 | +1.34 | |||
| Centre Democrats | 1,196 | 3.27 | -4.43 | |||
| Justice Party of Denmark | 998 | 2.73 | -1.23 | |||
| Communist Party of Denmark | 880 | 2.40 | -1.49 | |||
| Christian People's Party | 580 | 1.58 | -0.77 | |||
| Communist Workers Party | 134 | 0.37 | New | |||
| Rasmus Byberg | 23 | 0.06 | New | |||
| Poul Rasmussen | 0 | 0.00 | New | |||
| Total | 36,613 | |||||
| Source[23] | ||||||
| Parties | Vote | |||||
|---|---|---|---|---|---|---|
| Votes | % | + / - | ||||
| Social Democrats | 14,023 | 39.29 | +11.57 | |||
| Progress Party | 4,394 | 12.31 | +0.31 | |||
| Conservatives | 3,505 | 9.82 | +3.97 | |||
| Centre Democrats | 2,748 | 7.70 | +5.34 | |||
| Venstre | 2,722 | 7.63 | -12.67 | |||
| Social Liberals | 1,780 | 4.99 | -6.58 | |||
| Green Left | 1,521 | 4.26 | -1.94 | |||
| Justice Party of Denmark | 1,412 | 3.96 | +1.75 | |||
| Communist Party of Denmark | 1,390 | 3.89 | -0.66 | |||
| Left Socialists | 1,132 | 3.17 | +0.42 | |||
| Christian People's Party | 837 | 2.35 | -2.10 | |||
| Pensioners' Party | 225 | 0.63 | New | |||
| Total | 35,689 | |||||
| Source[24] | ||||||
| Parties | Vote | |||||
|---|---|---|---|---|---|---|
| Votes | % | + / - | ||||
| Social Democrats | 9,637 | 27.72 | +5.07 | |||
| Venstre | 7,057 | 20.30 | +12.37 | |||
| Progress Party | 4,170 | 12.00 | -1.86 | |||
| Social Liberals | 4,022 | 11.57 | -4.24 | |||
| Green Left | 2,157 | 6.20 | -0.70 | |||
| Conservatives | 2,035 | 5.85 | -3.75 | |||
| Communist Party of Denmark | 1,583 | 4.55 | +0.75 | |||
| Christian People's Party | 1,548 | 4.45 | +1.62 | |||
| Left Socialists | 955 | 2.75 | +0.62 | |||
| Centre Democrats | 821 | 2.36 | -8.67 | |||
| Justice Party of Denmark | 767 | 2.21 | -1.24 | |||
| Thomas Kaxe | 11 | 0.03 | New | |||
| Johs. Feddersen | 0 | 0.00 | New | |||
| Total | 34,763 | |||||
| Source[25] | ||||||
| Parties | Vote | |||||
|---|---|---|---|---|---|---|
| Votes | % | + / - | ||||
| Social Democrats | 7,963 | 22.65 | -12.65 | |||
| Social Liberals | 5,559 | 15.81 | -4.37 | |||
| Progress Party | 4,872 | 13.86 | New | |||
| Centre Democrats | 3,877 | 11.03 | New | |||
| Conservatives | 3,376 | 9.60 | -8.10 | |||
| Venstre | 2,786 | 7.93 | -1.07 | |||
| Green Left | 2,427 | 6.90 | -3.67 | |||
| Communist Party of Denmark | 1,334 | 3.80 | +2.37 | |||
| Justice Party of Denmark | 1,212 | 3.45 | +1.20 | |||
| Christian People's Party | 996 | 2.83 | +1.29 | |||
| Left Socialists | 749 | 2.13 | +0.10 | |||
| Total | 35,151 | |||||
| Source[26] | ||||||
| Parties | Vote | |||||
|---|---|---|---|---|---|---|
| Votes | % | + / - | ||||
| Social Democrats | 11,553 | 35.30 | +1.62 | |||
| Social Liberals | 6,605 | 20.18 | -0.20 | |||
| Conservatives | 5,793 | 17.70 | -4.58 | |||
| Green Left | 3,460 | 10.57 | +3.13 | |||
| Venstre | 2,944 | 9.00 | +0.08 | |||
| Justice Party of Denmark | 736 | 2.25 | +1.70 | |||
| Left Socialists | 665 | 2.03 | -1.35 | |||
| Christian People's Party | 504 | 1.54 | New | |||
| Communist Party of Denmark | 468 | 1.43 | +0.31 | |||
| Total | 32,728 | |||||
| Source[27] | ||||||
General elections in the 1960s
| Parties | Vote | |||||
|---|---|---|---|---|---|---|
| Votes | % | + / - | ||||
| Social Democrats | 20,358 | 33.68 | -5.34 | |||
| Conservatives | 13,468 | 22.28 | +2.41 | |||
| Social Liberals | 12,319 | 20.38 | +9.78 | |||
| Venstre | 5,389 | 8.92 | -1.66 | |||
| Green Left | 4,500 | 7.44 | -6.19 | |||
| Left Socialists | 2,045 | 3.38 | New | |||
| Liberal Centre | 1,207 | 2.00 | -1.87 | |||
| Communist Party of Denmark | 679 | 1.12 | +0.18 | |||
| Justice Party of Denmark | 332 | 0.55 | +0.04 | |||
| Independent Party | 125 | 0.21 | -0.70 | |||
| Thode Karlsen | 19 | 0.03 | -0.05 | |||
| H. Søndersted Andersen | 2 | 0.00 | New | |||
| Kirsten Lonning | 2 | 0.00 | New | |||
| Total | 60,445 | |||||
| Source[28] | ||||||
| Parties | Vote | |||||
|---|---|---|---|---|---|---|
| Votes | % | + / - | ||||
| Social Democrats | 22,300 | 39.02 | -5.19 | |||
| Conservatives | 11,354 | 19.87 | -2.60 | |||
| Green Left | 7,792 | 13.63 | +6.66 | |||
| Social Liberals | 6,061 | 10.60 | +3.52 | |||
| Venstre | 6,046 | 10.58 | -3.37 | |||
| Liberal Centre | 2,210 | 3.87 | New | |||
| Communist Party of Denmark | 539 | 0.94 | -0.40 | |||
| Independent Party | 518 | 0.91 | -1.17 | |||
| Justice Party of Denmark | 292 | 0.51 | -0.65 | |||
| Thode Karlsen | 43 | 0.08 | New | |||
| Total | 57,155 | |||||
| Source[29] | ||||||
| Parties | Vote | |||||
|---|---|---|---|---|---|---|
| Votes | % | + / - | ||||
| Social Democrats | 21,918 | 44.21 | -1.31 | |||
| Conservatives | 11,138 | 22.47 | +3.30 | |||
| Venstre | 6,916 | 13.95 | -0.11 | |||
| Social Liberals | 3,508 | 7.08 | -1.08 | |||
| Green Left | 3,453 | 6.97 | -0.15 | |||
| Independent Party | 1,033 | 2.08 | -0.72 | |||
| Communist Party of Denmark | 662 | 1.34 | +0.28 | |||
| Justice Party of Denmark | 577 | 1.16 | -0.94 | |||
| Peace Politics People's Party | 218 | 0.44 | New | |||
| Danish Unity | 126 | 0.25 | New | |||
| Elin Høgsbro Appel | 23 | 0.05 | New | |||
| Total | 49,572 | |||||
| Source[30] | ||||||
| Parties | Vote | |||||
|---|---|---|---|---|---|---|
| Votes | % | + / - | ||||
| Social Democrats | 16,789 | 45.52 | +3.25 | |||
| Conservatives | 7,072 | 19.17 | +2.57 | |||
| Venstre | 5,185 | 14.06 | -5.42 | |||
| Social Liberals | 3,009 | 8.16 | -5.37 | |||
| Green Left | 2,626 | 7.12 | New | |||
| Independent Party | 1,033 | 2.80 | +1.69 | |||
| Justice Party of Denmark | 776 | 2.10 | -2.25 | |||
| Communist Party of Denmark | 392 | 1.06 | -1.60 | |||
| Total | 36,882 | |||||
| Source[31] | ||||||
General elections in the 1950s
| Parties | Vote | |||||
|---|---|---|---|---|---|---|
| Votes | % | + / - | ||||
| Social Democrats | 12,511 | 42.27 | +0.56 | |||
| Venstre | 5,765 | 19.48 | +4.00 | |||
| Conservatives | 4,914 | 16.60 | -0.89 | |||
| Social Liberals | 4,005 | 13.53 | -2.96 | |||
| Justice Party of Denmark | 1,286 | 4.35 | +0.75 | |||
| Communist Party of Denmark | 786 | 2.66 | -1.04 | |||
| Independent Party | 329 | 1.11 | -0.41 | |||
| Total | 29,596 | |||||
| Source[32] | ||||||
September 1953 Danish Folketing election
| Parties | Vote | |||||
|---|---|---|---|---|---|---|
| Votes | % | + / - | ||||
| Social Democrats | 10,275 | 41.71 | +2.13 | |||
| Conservatives | 4,307 | 17.49 | -0.57 | |||
| Social Liberals | 4,063 | 16.49 | -1.68 | |||
| Venstre | 3,813 | 15.48 | +1.62 | |||
| Communist Party of Denmark | 912 | 3.70 | -0.51 | |||
| Justice Party of Denmark | 887 | 3.60 | -1.69 | |||
| Independent Party | 375 | 1.52 | New | |||
| Total | 24,632 | |||||
| Source[33] | ||||||
April 1953 Danish Folketing election
| Parties | Vote | |||||
|---|---|---|---|---|---|---|
| Votes | % | + / - | ||||
| Social Democrats | 9,096 | 39.58 | -0.27 | |||
| Social Liberals | 4,176 | 18.17 | +0.64 | |||
| Conservatives | 4,150 | 18.06 | -0.73 | |||
| Venstre | 3,186 | 13.86 | +0.75 | |||
| Justice Party of Denmark | 1,215 | 5.29 | -1.64 | |||
| Communist Party of Denmark | 967 | 4.21 | +0.42 | |||
| Danish Unity | 191 | 0.83 | New | |||
| Total | 22,981 | |||||
| Source[34] | ||||||
1950 Danish Folketing election
| Parties | Vote | |||||
|---|---|---|---|---|---|---|
| Votes | % | + / - | ||||
| Social Democrats | 8,564 | 39.85 | -3.59 | |||
| Conservatives | 4,039 | 18.79 | +4.58 | |||
| Social Liberals | 3,768 | 17.53 | +6.68 | |||
| Venstre | 2,818 | 13.11 | -7.42 | |||
| Justice Party of Denmark | 1,489 | 6.93 | +3.03 | |||
| Communist Party of Denmark | 814 | 3.79 | -2.36 | |||
| Total | 21,492 | |||||
| Source[35] | ||||||
General elections in the 1940s
1947 Danish Folketing election
| Parties | Vote | |||||
|---|---|---|---|---|---|---|
| Votes | % | + / - | ||||
| Social Democrats | 9,043 | 43.44 | +8.24 | |||
| Venstre | 4,273 | 20.53 | +5.36 | |||
| Conservatives | 2,957 | 14.21 | -5.97 | |||
| Social Liberals | 2,259 | 10.85 | -1.37 | |||
| Communist Party of Denmark | 1,280 | 6.15 | -7.21 | |||
| Justice Party of Denmark | 812 | 3.90 | +2.20 | |||
| Danish Unity | 191 | 0.92 | -1.23 | |||
| Total | 20,815 | |||||
| Source[36] | ||||||
1945 Danish Folketing election
| Parties | Vote | |||||
|---|---|---|---|---|---|---|
| Votes | % | + / - | ||||
| Social Democrats | 7,128 | 35.20 | -14.39 | |||
| Conservatives | 4,086 | 20.18 | -3.08 | |||
| Venstre | 3,071 | 15.17 | +4.53 | |||
| Communist Party of Denmark | 2,706 | 13.36 | New | |||
| Social Liberals | 2,475 | 12.22 | +0.95 | |||
| Danish Unity | 436 | 2.15 | +0.71 | |||
| Justice Party of Denmark | 344 | 1.70 | +0.16 | |||
| Edward Hjalmar Larsen | 4 | 0.02 | New | |||
| Total | 20,250 | |||||
| Source[37] | ||||||
1943 Danish Folketing election
| Parties | Vote | |||||
|---|---|---|---|---|---|---|
| Votes | % | + / - | ||||
| Social Democrats | 9,686 | 49.59 | +1.47 | |||
| Conservatives | 4,544 | 23.26 | +2.05 | |||
| Social Liberals | 2,201 | 11.27 | -0.01 | |||
| Venstre | 2,079 | 10.64 | -0.71 | |||
| National Socialist Workers' Party of Denmark | 435 | 2.23 | +0.17 | |||
| Justice Party of Denmark | 300 | 1.54 | -0.32 | |||
| Danish Unity | 282 | 1.44 | +1.20 | |||
| Chr. Orla Nielsen | 7 | 0.04 | New | |||
| Total | 19,534 | |||||
| Source[38] | ||||||
General elections in the 1930s
1939 Danish Folketing election
| Parties | Vote | |||||
|---|---|---|---|---|---|---|
| Votes | % | + / - | ||||
| Social Democrats | 7,877 | 48.12 | -4.99 | |||
| Conservatives | 3,472 | 21.21 | -0.11 | |||
| Venstre | 1,858 | 11.35 | +1.27 | |||
| Social Liberals | 1,847 | 11.28 | +1.04 | |||
| Communist Party of Denmark | 431 | 2.63 | +1.22 | |||
| National Socialist Workers' Party of Denmark | 337 | 2.06 | +1.40 | |||
| Justice Party of Denmark | 305 | 1.86 | -0.46 | |||
| National Cooperation | 107 | 0.65 | New | |||
| Farmers' Party | 97 | 0.59 | -0.28 | |||
| Danish Unity | 39 | 0.24 | New | |||
| Total | 16,370 | |||||
| Source[39] | ||||||
1935 Danish Folketing election
| Parties | Vote | |||||
|---|---|---|---|---|---|---|
| Votes | % | + / - | ||||
| Social Democrats | 8,347 | 53.11 | +2.75 | |||
| Conservatives | 3,350 | 21.32 | +0.86 | |||
| Social Liberals | 1,609 | 10.24 | +0.48 | |||
| Venstre | 1,584 | 10.08 | -5.87 | |||
| Justice Party of Denmark | 364 | 2.32 | -0.27 | |||
| Communist Party of Denmark | 222 | 1.41 | +0.57 | |||
| Independent People's Party | 136 | 0.87 | New | |||
| National Socialist Workers' Party of Denmark | 103 | 0.66 | New | |||
| Total | 15,715 | |||||
| Source[40] | ||||||
1932 Danish Folketing election
| Parties | Vote | |||||
|---|---|---|---|---|---|---|
| Votes | % | + / - | ||||
| Social Democrats | 7,322 | 50.36 | +1.49 | |||
| Conservatives | 2,975 | 20.46 | +1.50 | |||
| Venstre | 2,319 | 15.95 | -3.26 | |||
| Social Liberals | 1,419 | 9.76 | -0.58 | |||
| Justice Party of Denmark | 377 | 2.59 | +0.09 | |||
| Communist Party of Denmark | 122 | 0.84 | +0.72 | |||
| W. Colding | 4 | 0.03 | New | |||
| Christian Sørensen | 0 | 0.00 | New | |||
| Total | 14,538 | |||||
| Source[41] | ||||||
General elections in the 1920s
1929 Danish Folketing election
| Parties | Vote | |||||
|---|---|---|---|---|---|---|
| Votes | % | + / - | ||||
| Social Democrats | 6,408 | 48.87 | +5.92 | |||
| Venstre | 2,519 | 19.21 | +1.07 | |||
| Conservatives | 2,486 | 18.96 | -5.56 | |||
| Social Liberals | 1,356 | 10.34 | -2.06 | |||
| Justice Party of Denmark | 328 | 2.50 | +0.75 | |||
| Communist Party of Denmark | 16 | 0.12 | -0.12 | |||
| Total | 13,113 | |||||
| Source[42] | ||||||
1926 Danish Folketing election
| Parties | Vote | |||||
|---|---|---|---|---|---|---|
| Votes | % | + / - | ||||
| Social Democrats | 5,267 | 42.95 | +3.26 | |||
| Conservatives | 3,007 | 24.52 | -0.60 | |||
| Venstre | 2,225 | 18.14 | +2.02 | |||
| Social Liberals | 1,520 | 12.40 | -3.91 | |||
| Justice Party of Denmark | 214 | 1.75 | +0.18 | |||
| Communist Party of Denmark | 30 | 0.24 | +0.03 | |||
| Total | 12,263 | |||||
| Source[43] | ||||||
1924 Danish Folketing election
| Parties | Vote | |||||
|---|---|---|---|---|---|---|
| Votes | % | + / - | ||||
| Social Democrats | 4,727 | 39.69 | +3.25 | |||
| Conservatives | 2,992 | 25.12 | -1.10 | |||
| Social Liberals | 1,942 | 16.31 | +1.05 | |||
| Venstre | 1,920 | 16.12 | -3.78 | |||
| Justice Party of Denmark | 187 | 1.57 | New | |||
| Farmer Party | 117 | 0.98 | New | |||
| Communist Party of Denmark | 25 | 0.21 | New | |||
| Total | 11,910 | |||||
| Source[44] | ||||||
September 1920 Danish Folketing election
| Parties | Vote | |||||
|---|---|---|---|---|---|---|
| Votes | % | + / - | ||||
| Social Democrats | 3,986 | 36.44 | +4.31 | |||
| Conservatives | 2,868 | 26.22 | -1.30 | |||
| Venstre | 2,177 | 19.90 | -2.47 | |||
| Social Liberals | 1,669 | 15.26 | +0.52 | |||
| Industry Party | 198 | 1.81 | -1.04 | |||
| Danish Left Socialist Party | 40 | 0.37 | New | |||
| Total | 10,938 | |||||
| Source[45] | ||||||
July 1920 Danish Folketing election
| Parties | Vote | |||||
|---|---|---|---|---|---|---|
| Votes | % | + / - | ||||
| Social Democrats | 2,893 | 32.13 | +0.38 | |||
| Conservatives | 2,478 | 27.52 | +1.38 | |||
| Venstre | 2,014 | 22.37 | +0.36 | |||
| Social Liberals | 1,327 | 14.74 | -0.91 | |||
| Industry Party | 257 | 2.85 | -0.92 | |||
| A. Sterregaard | 35 | 0.39 | New | |||
| Total | 9,004 | |||||
| Source[46] | ||||||
April 1920 Danish Folketing election
| Parties | Vote | |||||
|---|---|---|---|---|---|---|
| Votes | % | |||||
| Social Democrats | 3,047 | 31.75 | ||||
| Conservatives | 2,509 | 26.14 | ||||
| Venstre | 2,112 | 22.01 | ||||
| Social Liberals | 1,502 | 15.65 | ||||
| Industry Party | 362 | 3.77 | ||||
| Daniel Nielsen | 43 | 0.45 | ||||
| Centrum | 22 | 0.23 | ||||
| Total | 9,597 | |||||
| Source[47] | ||||||
European Parliament elections results
2019 European Parliament election in Denmark
| Parties | Vote | |||||
|---|---|---|---|---|---|---|
| Votes | % | + / - | ||||
| Venstre | 9,682 | 21.50 | +5.90 | |||
| Social Democrats | 9,489 | 21.07 | +1.86 | |||
| Green Left | 6,679 | 14.83 | +1.15 | |||
| Social Liberals | 5,344 | 11.87 | +3.75 | |||
| Danish People's Party | 4,227 | 9.39 | -14.78 | |||
| Conservatives | 3,043 | 6.76 | -1.37 | |||
| Red–Green Alliance | 2,505 | 5.56 | New | |||
| The Alternative | 1,611 | 3.58 | New | |||
| People's Movement against the EU | 1,605 | 3.56 | -4.79 | |||
| Liberal Alliance | 853 | 1.89 | -0.84 | |||
| Total | 45,038 | |||||
| Source[48] | ||||||
2014 European Parliament election in Denmark
| Parties | Vote | |||||
|---|---|---|---|---|---|---|
| Votes | % | + / - | ||||
| Danish People's Party | 8,944 | 24.17 | +9.62 | |||
| Social Democrats | 7,110 | 19.21 | -1.28 | |||
| Venstre | 5,773 | 15.60 | -2.89 | |||
| Green Left | 5,061 | 13.68 | -4.43 | |||
| People's Movement against the EU | 3,090 | 8.35 | +0.36 | |||
| Conservatives | 3,010 | 8.13 | -4.14 | |||
| Social Liberals | 3,006 | 8.12 | +3.07 | |||
| Liberal Alliance | 1,009 | 2.73 | +2.11 | |||
| Total | 37,003 | |||||
| Source[49] | ||||||
2009 European Parliament election in Denmark
| Parties | Vote | |||||
|---|---|---|---|---|---|---|
| Votes | % | + / - | ||||
| Social Democrats | 7,638 | 20.49 | -11.66 | |||
| Venstre | 6,890 | 18.49 | +3.68 | |||
| Green Left | 6,749 | 18.11 | +8.54 | |||
| Danish People's Party | 5,423 | 14.55 | +7.81 | |||
| Conservatives | 4,575 | 12.27 | -2.10 | |||
| People's Movement against the EU | 2,979 | 7.99 | +2.21 | |||
| Social Liberals | 1,882 | 5.05 | -1.92 | |||
| June Movement | 905 | 2.43 | -6.36 | |||
| Liberal Alliance | 230 | 0.62 | New | |||
| Total | 37,271 | |||||
| Source[50] | ||||||
2004 European Parliament election in Denmark
| Parties | Vote | |||||
|---|---|---|---|---|---|---|
| Votes | % | + / - | ||||
| Social Democrats | 8,830 | 32.15 | +17.49 | |||
| Venstre | 4,068 | 14.81 | -5.57 | |||
| Conservatives | 3,947 | 14.37 | +5.49 | |||
| Green Left | 2,629 | 9.57 | -0.69 | |||
| June Movement | 2,415 | 8.79 | -7.04 | |||
| Social Liberals | 1,913 | 6.97 | -4.42 | |||
| Danish People's Party | 1,851 | 6.74 | +0.94 | |||
| People's Movement against the EU | 1,587 | 5.78 | -1.62 | |||
| Christian Democrats | 225 | 0.82 | -0.72 | |||
| Total | 27,465 | |||||
| Source[51] | ||||||
1999 European Parliament election in Denmark
| Parties | Vote | |||||
|---|---|---|---|---|---|---|
| Votes | % | + / - | ||||
| Venstre | 5,543 | 20.38 | +6.28 | |||
| June Movement | 4,306 | 15.83 | -0.63 | |||
| Social Democrats | 3,988 | 14.66 | +0.72 | |||
| Social Liberals | 3,097 | 11.39 | -1.12 | |||
| Green Left | 2,791 | 10.26 | -0.65 | |||
| Conservatives | 2,416 | 8.88 | -9.91 | |||
| People's Movement against the EU | 2,013 | 7.40 | -2.12 | |||
| Danish People's Party | 1,576 | 5.80 | New | |||
| Centre Democrats | 1,044 | 3.84 | +3.02 | |||
| Christian Democrats | 420 | 1.54 | +0.81 | |||
| Progress Party | 95 | 0.35 | -1.87 | |||
| Total | 27,194 | |||||
| Source[52] | ||||||
1994 European Parliament election in Denmark
| Parties | Vote | |||||
|---|---|---|---|---|---|---|
| Votes | % | + / - | ||||
| Conservatives | 5,231 | 18.79 | +4.01 | |||
| June Movement | 4,582 | 16.46 | New | |||
| Venstre | 3,925 | 14.10 | +1.90 | |||
| Social Democrats | 3,879 | 13.94 | -7.93 | |||
| Social Liberals | 3,483 | 12.51 | +9.02 | |||
| Green Left | 3,037 | 10.91 | +0.24 | |||
| People's Movement against the EU | 2,650 | 9.52 | -13.14 | |||
| Progress Party | 618 | 2.22 | -1.54 | |||
| Centre Democrats | 228 | 0.82 | -7.99 | |||
| Christian Democrats | 203 | 0.73 | -1.04 | |||
| Total | 27,836 | |||||
| Source[53] | ||||||
1989 European Parliament election in Denmark
| Parties | Vote | |||||
|---|---|---|---|---|---|---|
| Votes | % | + / - | ||||
| People's Movement against the EU | 5,198 | 22.66 | -1.58 | |||
| Social Democrats | 5,018 | 21.87 | +3.72 | |||
| Conservatives | 3,392 | 14.78 | -8.57 | |||
| Venstre | 2,798 | 12.20 | +5.28 | |||
| Green Left | 2,448 | 10.67 | +0.49 | |||
| Centre Democrats | 2,022 | 8.81 | +2.61 | |||
| Progress Party | 862 | 3.76 | +0.96 | |||
| Social Liberals | 800 | 3.49 | -0.81 | |||
| Christian Democrats | 405 | 1.77 | -0.02 | |||
| Total | 22,943 | |||||
| Source[54] | ||||||
1984 European Parliament election in Denmark
| Parties | Vote | |||||
|---|---|---|---|---|---|---|
| Votes | % | |||||
| People's Movement against the EU | 5,914 | 24.24 | ||||
| Conservatives | 5,696 | 23.35 | ||||
| Social Democrats | 4,427 | 18.15 | ||||
| Green Left | 2,483 | 10.18 | ||||
| Venstre | 1,687 | 6.92 | ||||
| Centre Democrats | 1,512 | 6.20 | ||||
| Social Liberals | 1,050 | 4.30 | ||||
| Progress Party | 682 | 2.80 | ||||
| Left Socialists | 505 | 2.07 | ||||
| Christian Democrats | 437 | 1.79 | ||||
| Total | 24,393 | |||||
| Source[55] | ||||||
Referendums
2022 Danish European Union opt-out referendum[56]
| Option | Votes | % |
|---|---|---|
| ✓ YES | 32,809 | 71.99 |
| X NO | 12,767 | 28.01 |
2015 Danish European Union opt-out referendum[57]
| Option | Votes | % |
|---|---|---|
| ✓ YES | 23,885 | 51.88 |
| X NO | 22,157 | 48.12 |
2014 Danish Unified Patent Court membership referendum[58]
| Option | Votes | % |
|---|---|---|
| ✓ YES | 23,615 | 65.32 |
| X NO | 12,537 | 34.68 |
2009 Danish Act of Succession referendum[59]
| Option | Votes | % |
|---|---|---|
| ✓ YES | 28,901 | 85.60 |
| X NO | 4,861 | 14.40 |
2000 Danish euro referendum[60]
| Option | Votes | % |
|---|---|---|
| X NO | 22,804 | 50.59 |
| ✓ YES | 22,270 | 49.41 |
1998 Danish Amsterdam Treaty referendum[61]
| Option | Votes | % |
|---|---|---|
| ✓ YES | 22,134 | 56.21 |
| X NO | 17,243 | 43.79 |
1993 Danish Maastricht Treaty referendum[62]
| Option | Votes | % |
|---|---|---|
| ✓ YES | 24,964 | 57.58 |
| X NO | 18,389 | 42.42 |
1992 Danish Maastricht Treaty referendum[63]
| Option | Votes | % |
|---|---|---|
| X NO | 21,181 | 50.33 |
| ✓ YES | 20,901 | 49.67 |
1986 Danish Single European Act referendum[64]
| Option | Votes | % |
|---|---|---|
| ✓ YES | 18,647 | 53.38 |
| X NO | 16,284 | 46.62 |
1972 Danish European Communities membership referendum[65]
| Option | Votes | % |
|---|---|---|
| ✓ YES | 22,166 | 62.58 |
| X NO | 13,257 | 37.42 |
1953 Danish constitutional and electoral age referendum[66]
| Option | Votes | % |
|---|---|---|
| ✓ YES | 14,840 | 81.44 |
| X NO | 3,382 | 18.56 |
| 23 years | 10,377 | 54.46 |
| 21 years | 8,679 | 45.54 |
1939 Danish constitutional referendum[67]
| Option | Votes | % |
|---|---|---|
| ✓ YES | 10,702 | 91.93 |
| X NO | 939 | 8.07 |
References
- "Roskildekredsen". kmdvalg.dk (in Danish). Retrieved 2023-06-05.
- "Beretning om Forhandlingerne paa Rigsdagen". Rigsdagstidende. II: Spalte 3892 ff.
- "Nye valgkredse fordeler stemmerne anderledes". dr.dk (in Danish). Retrieved 2023-06-05.
- "Beretning om nye valgkredse som følge af kommunalreformen" (in Danish). Retrieved 2023-06-05.
- "Det danske valgsystem: Valg til Folketinget". valg.im (in Danish). Retrieved 2023-06-05.
- "36 Roskilde". dataforsyningen.dk (in Danish). Retrieved 2023-06-05.
- "Beretning om Forhandlingerne paa Rigsdagen". Rigsdagstidende. II: Spalte 3892 ff.
- "Valgresultater fra tidligere valg:". kmdvalg (in Danish). Retrieved 2023-06-05.
- "FOLKETINGSVALG TIRSDAG 1. NOVEMBER 2022". valg.im (in Danish). Retrieved 2023-06-27.
- "FOLKETINGSVALG ONSDAG 5. JUNI 2019". valg.im (in Danish). Retrieved 2023-06-27.
- "FOLKETINGSVALG TORSDAG 18. JUNI 2015". valg.im (in Danish). Retrieved 2023-06-27.
- "FOLKETINGSVALG TORSDAG 15. SEPTEMBER 2011". valg.im (in Danish). Retrieved 2023-06-27.
- "Folketingsvalget den 13. november 2007". valg.im (in Danish). Retrieved 2023-06-27.
- "valg2005.book" (PDF). valg.im (in Danish). Retrieved 2023-06-27.
- "BMTABEL" (PDF). valg.im (in Danish). Retrieved 2023-06-27.
- "VALG98" (PDF). valg.im (in Danish). Retrieved 2023-06-27.
- "VALG94" (PDF). valg.im (in Danish). Retrieved 2023-06-27.
- "VALG90" (PDF). valg.im (in Danish). Retrieved 2023-06-27.
- "Folketingsvalget den 10. maj 1988". valg.im (in Danish). Retrieved 2023-06-27.
- "Folketingsvalget den 8.september 1987". dst.dk (in Danish). Retrieved 2023-06-27.
- "Folketingsvalget den 10. januar 1984". dst.dk (in Danish). Retrieved 2023-06-27.
- "Folketingsvalget den 8. december 1981". dst.dk (in Danish). Retrieved 2023-06-27.
- "Folketingsvalget den 23. oktober 1979". dst.dk (in Danish). Retrieved 2023-06-27.
- "Folketingsvalget den 15. februar 1977". dst.dk (in Danish). Retrieved 2023-06-27.
- "Folketingsvalget den 9. januar 1975". dst.dk (in Danish). Retrieved 2023-06-27.
- "Folketingsvalget den 4. december 1973". dst.dk (in Danish). Retrieved 2023-06-27.
- "Folketingsvalget den 21. september 1971 samt folkeafstemningen". dst.dk (in Danish). Retrieved 2023-06-27.
- "Folketingsvalget den 23. januar 1968". dst.dk (in Danish). Retrieved 2023-06-27.
- "Folketingsvalget den 22. november 1966". dst.dk (in Danish). Retrieved 2023-06-27.
- "Folketingsvalget den 22. september 1964". dst.dk (in Danish). Retrieved 2023-06-27.
- "Folketingsvalget den 15. november 1960". dst.dk (in Danish). Retrieved 2023-06-27.
- "Folketingsvalget den 14. maj 1957". dst.dk (in Danish). Retrieved 2023-06-27.
- "Folketingsvalget den 22. september 1953". dst.dk (in Danish). Retrieved 2023-06-27.
- "Rigsdagsvalgene og folkeafstemningerne i april og maj 1953". dst.dk (in Danish). Retrieved 2023-06-27.
- "Folketingsvalget den 5. september 1950". dst.dk (in Danish). Retrieved 2023-06-27.
- "Folketingsvalget den 28. oktober 1947". dst.dk (in Danish). Retrieved 2023-06-27.
- "Rigsdagsvalgene i oktober og november 1945". dst.dk (in Danish). Retrieved 2023-06-27.
- "Rigsdagsvalgene i marts og april 1943". dst.dk (in Danish). Retrieved 2023-06-27.
- "Rigsdagsvalgene og Folkeafstemningen i april og maj 1939". dst.dk (in Danish). Retrieved 2023-06-27.
- "Folketingsvalget den 22. oktober 1935". dst.dk (in Danish). Retrieved 2023-06-27.
- "Folketingsvalget den 16. november 1932". dst.dk (in Danish). Retrieved 2023-06-27.
- "Folketingsvalget den 24. april 1929". dst.dk (in Danish). Retrieved 2023-06-27.
- "Folketingsvalget den 2. december 1926". dst.dk (in Danish). Retrieved 2023-06-27.
- "Folketingsvalget den 11. april 1924". dst.dk (in Danish). Retrieved 2023-06-27.
- "Rigsdagsvalgene september-oktober 1920". dst.dk (in Danish). Retrieved 2023-06-27.
- "Rigsdagsvalgene juli-august 1920". dst.dk (in Danish). Retrieved 2023-06-27.
- "Folketingsvalget den 26. april 1920". dst.dk (in Danish). Retrieved 2023-06-27.
- "EUROPA-PARLAMENTSVALG SØNDAG 26. MAJ 2019". dst.dk (in Danish). Retrieved 2023-07-01.
- "EUROPA-PARLAMENTSVALG SØNDAG 25. MAJ 2014". dst.dk (in Danish). Retrieved 2023-07-01.
- "EUROPA-PARLAMENTSVALG SØNDAG 7. JUNI 2009". dst.dk (in Danish). Retrieved 2023-07-01.
- "EUROPA-PARLAMENTSVALGET DEN 13. JUNI 2004" (PDF). im.dk (in Danish). Retrieved 2023-07-01.
- "VALGET TIL EUROPA-PARLAMENTET DEN 10. JUNI 1999" (PDF). im.dk (in Danish). Retrieved 2023-07-01.
- "VALGET TIL EUROPA-PARLAMENTET DEN 9. JUNI 1994" (PDF). im.dk (in Danish). Retrieved 2023-07-01.
- "Valget til Europa-parlamentet den 15. juni 1989". dst.dk (in Danish). Retrieved 2023-07-01.
- "Valget til Europa-Parlamentet den 14. juni 1984". dst.dk (in Danish). Retrieved 2023-07-01.
- "FOLKEAFSTEMNING ONSDAG 1. JUNI 2022". dst.dk (in Danish). Retrieved 2023-07-05.
- "FOLKEAFSTEMNING TORSDAG 3. DECEMBER 2015". dst.dk (in Danish). Retrieved 2023-07-05.
- "FOLKEAFSTEMNING SØNDAG 25. MAJ 2014". dst.dk (in Danish). Retrieved 2023-07-05.
- "FOLKEAFSTEMNING SØNDAG 7. JUNI 2009". dst.dk (in Danish). Retrieved 2023-07-05.
- "FOLKEAFSTEMNINGEN DEN 28. SEPTEMBER 2000 OM DANMARKS DELTAGELSE I DEN FÆLLES VALUTA" (PDF). valg.im (in Danish). Retrieved 2023-07-05.
- "FOLKEAFSTEMNINGEN DEN 28. MAJ 1998OM DANMARKS TILTRÆDELSE AF AMSTERDAMTRAKTATEN" (PDF). valg.im (in Danish). Retrieved 2023-07-05.
- "FOLKEAFSTEMNINGEN DEN 18. MAJ 1993 OM DANMARKS TILTRÆDELSE AF EDINBURGH-AFGØRELSEN OG MAASTRICHT-TRAKTATEN". dst.dk (in Danish). Retrieved 2023-07-05.
- "Folkeafstemningen den 1. juni 1992 om Danmarks tiltrædelse af traktaten om Den Europæiske Union". dst.dk (in Danish). Retrieved 2023-07-05.
- "Vejledende folkeafstemning torsdag den 27. februar 1986 om Danmarks tiltrædelse af EF- pakken". dst.dk (in Danish). Retrieved 2023-07-05.
- "Folkeafstemningen om Danmarks tiltrædelse af De europæiske Fælleskaber 2. oktober 1972". dst.dk (in Danish). Retrieved 2023-07-05.
- "Publikationsfortegnelse vedrørende Folkeafstemninger". dst.dk (in Danish). Retrieved 2023-07-05.
- "Publikationsfortegnelse vedrørende Folkeafstemninger". dst.dk (in Danish). Retrieved 2023-07-05.