Sønderborg (nomination district)
Sønderborg nominating district is one of the 92 nominating districts that exists for Danish elections following the 2007 municipal reform.[3][4][5] It consists of Sønderborg municipality.[6] It was created in 1920[7] following its reunification with Denmark, though its boundaries have been changed since then.
| Sønderborg | |
|---|---|
| Sønderborg | |
| Nomination district constituency for the Folketing | |
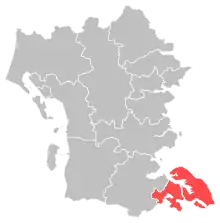 Location of Sønderborg within South Jutland | |
 Location of South Jutland within Denmark | |
| Municipalities | Sønderborg |
| Constituency | South Jutland |
| Electorate | 53,712 (2022)[1] |
| Current constituency | |
| Created | 1920[2] |
In general elections, parties commonly associated with the blue bloc tends to get a little more votes.[8]
General elections results
General elections in the 2020s
| Parties | Vote | |||||
|---|---|---|---|---|---|---|
| Votes | % | + / - | ||||
| Social Democrats | 14,548 | 33.54 | +3.53 | |||
| Venstre | 6,607 | 15.23 | -12.67 | |||
| Denmark Democrats | 4,918 | 11.34 | New | |||
| Moderates | 3,660 | 8.44 | New | |||
| New Right | 3,039 | 7.01 | +2.22 | |||
| Liberal Alliance | 2,798 | 6.45 | +4.80 | |||
| Green Left | 2,023 | 4.66 | +0.43 | |||
| Conservatives | 1,636 | 3.77 | -0.80 | |||
| Danish People's Party | 1,266 | 2.92 | -9.36 | |||
| Red–Green Alliance | 967 | 2.23 | -0.98 | |||
| Social Liberals | 932 | 2.15 | -3.58 | |||
| The Alternative | 537 | 1.24 | -0.26 | |||
| Christian Democrats | 210 | 0.48 | -0.80 | |||
| Independent Greens | 206 | 0.47 | New | |||
| Kent Nielsen | 24 | 0.06 | New | |||
| Kenneth Vestergaard | 5 | 0.01 | New | |||
| Total | 43,376 | |||||
| Source[9] | ||||||
General elections in the 2010s
| Parties | Vote | |||||
|---|---|---|---|---|---|---|
| Votes | % | + / - | ||||
| Social Democrats | 13,470 | 30.01 | +4.73 | |||
| Venstre | 12,521 | 27.90 | +6.36 | |||
| Danish People's Party | 5,511 | 12.28 | -18.16 | |||
| Social Liberals | 2,572 | 5.73 | +1.46 | |||
| New Right | 2,151 | 4.79 | New | |||
| Conservatives | 2,049 | 4.57 | +2.81 | |||
| Green Left | 1,897 | 4.23 | +1.80 | |||
| Red–Green Alliance | 1,440 | 3.21 | -1.06 | |||
| Stram Kurs | 918 | 2.05 | New | |||
| Liberal Alliance | 739 | 1.65 | -5.59 | |||
| The Alternative | 671 | 1.50 | -0.75 | |||
| Christian Democrats | 574 | 1.28 | +0.76 | |||
| Klaus Riskær Pedersen Party | 281 | 0.63 | New | |||
| Michael Thomsen | 84 | 0.19 | New | |||
| Total | 44,878 | |||||
| Source[10] | ||||||
| Parties | Vote | |||||
|---|---|---|---|---|---|---|
| Votes | % | + / - | ||||
| Danish People's Party | 14,124 | 30.44 | +15.01 | |||
| Social Democrats | 11,728 | 25.28 | -2.12 | |||
| Venstre | 9,994 | 21.54 | -9.55 | |||
| Liberal Alliance | 3,357 | 7.24 | +2.87 | |||
| Social Liberals | 1,983 | 4.27 | -1.60 | |||
| Red–Green Alliance | 1,981 | 4.27 | +1.18 | |||
| Green Left | 1,129 | 2.43 | -4.67 | |||
| The Alternative | 1,042 | 2.25 | New | |||
| Conservatives | 818 | 1.76 | -3.33 | |||
| Christian Democrats | 240 | 0.52 | -0.01 | |||
| Total | 46,396 | |||||
| Source[11] | ||||||
| Parties | Vote | |||||
|---|---|---|---|---|---|---|
| Votes | % | + / - | ||||
| Venstre | 14,770 | 31.09 | -2.39 | |||
| Social Democrats | 13,017 | 27.40 | +1.76 | |||
| Danish People's Party | 7,329 | 15.43 | -2.73 | |||
| Green Left | 3,374 | 7.10 | -2.39 | |||
| Social Liberals | 2,790 | 5.87 | +2.83 | |||
| Conservatives | 2,416 | 5.09 | -2.06 | |||
| Liberal Alliance | 2,077 | 4.37 | +2.56 | |||
| Red–Green Alliance | 1,467 | 3.09 | +2.37 | |||
| Christian Democrats | 251 | 0.53 | +0.01 | |||
| Jørn Bjorholm | 12 | 0.03 | New | |||
| Niesl-Aage Bjerre | 6 | 0.01 | New | |||
| Total | 47,509 | |||||
| Source[12] | ||||||
General elections in the 2000s
| Parties | Vote | |||||
|---|---|---|---|---|---|---|
| Votes | % | + / - | ||||
| Venstre | 16,128 | 33.48 | +1.32 | |||
| Social Democrats | 12,353 | 25.64 | -2.00 | |||
| Danish People's Party | 8,746 | 18.16 | +1.29 | |||
| Green Left | 4,572 | 9.49 | +5.54 | |||
| Conservatives | 3,442 | 7.15 | -1.69 | |||
| Social Liberals | 1,464 | 3.04 | -3.25 | |||
| New Alliance | 870 | 1.81 | New | |||
| Red–Green Alliance | 347 | 0.72 | -0.97 | |||
| Christian Democrats | 250 | 0.52 | -1.09 | |||
| Total | 48,172 | |||||
| Source[13] | ||||||
| Parties | Vote | |||||
|---|---|---|---|---|---|---|
| Votes | % | + / - | ||||
| Venstre | 8,645 | 32.16 | -0.14 | |||
| Social Democrats | 7,429 | 27.64 | -3.32 | |||
| Danish People's Party | 4,536 | 16.87 | +0.97 | |||
| Conservatives | 2,377 | 8.84 | +0.69 | |||
| Social Liberals | 1,690 | 6.29 | +2.30 | |||
| Green Left | 1,062 | 3.95 | +0.16 | |||
| Red–Green Alliance | 454 | 1.69 | +0.72 | |||
| Christian Democrats | 432 | 1.61 | -0.28 | |||
| Centre Democrats | 196 | 0.73 | -0.51 | |||
| Minority Party | 61 | 0.23 | New | |||
| Total | 26,882 | |||||
| Source[14] | ||||||
| Parties | Vote | |||||
|---|---|---|---|---|---|---|
| Votes | % | + / - | ||||
| Venstre | 8,958 | 32.30 | +6.13 | |||
| Social Democrats | 8,584 | 30.96 | -7.74 | |||
| Danish People's Party | 4,409 | 15.90 | +6.65 | |||
| Conservatives | 2,260 | 8.15 | +0.04 | |||
| Social Liberals | 1,107 | 3.99 | +0.97 | |||
| Green Left | 1,050 | 3.79 | -1.37 | |||
| Christian People's Party | 523 | 1.89 | -0.35 | |||
| Centre Democrats | 345 | 1.24 | -2.52 | |||
| Red–Green Alliance | 268 | 0.97 | -0.07 | |||
| Progress Party | 226 | 0.82 | -1.17 | |||
| Total | 27,730 | |||||
| Source[15] | ||||||
General elections in the 1990s
| Parties | Vote | |||||
|---|---|---|---|---|---|---|
| Votes | % | + / - | ||||
| Social Democrats | 10,700 | 38.70 | +0.62 | |||
| Venstre | 7,237 | 26.17 | +2.58 | |||
| Danish People's Party | 2,559 | 9.25 | New | |||
| Conservatives | 2,242 | 8.11 | -8.64 | |||
| Green Left | 1,426 | 5.16 | +0.62 | |||
| Centre Democrats | 1,040 | 3.76 | +1.61 | |||
| Social Liberals | 834 | 3.02 | -0.58 | |||
| Christian People's Party | 619 | 2.24 | +0.61 | |||
| Progress Party | 550 | 1.99 | -5.92 | |||
| Red–Green Alliance | 287 | 1.04 | -0.66 | |||
| Democratic Renewal | 151 | 0.55 | New | |||
| Leon Elmkjær | 5 | 0.02 | -0.02 | |||
| Total | 27,650 | |||||
| Source[16] | ||||||
| Parties | Vote | |||||
|---|---|---|---|---|---|---|
| Votes | % | + / - | ||||
| Social Democrats | 10,310 | 38.08 | -2.29 | |||
| Venstre | 6,388 | 23.59 | +8.71 | |||
| Conservatives | 4,536 | 16.75 | -2.56 | |||
| Progress Party | 2,143 | 7.91 | -0.37 | |||
| Green Left | 1,229 | 4.54 | -0.20 | |||
| Social Liberals | 976 | 3.60 | +0.85 | |||
| Centre Democrats | 582 | 2.15 | -2.06 | |||
| Red–Green Alliance | 459 | 1.70 | +1.00 | |||
| Christian People's Party | 441 | 1.63 | -0.21 | |||
| Leon Elmkjær | 12 | 0.04 | New | |||
| Total | 27,076 | |||||
| Source[17] | ||||||
| Parties | Vote | |||||
|---|---|---|---|---|---|---|
| Votes | % | + / - | ||||
| Social Democrats | 10,583 | 40.37 | +6.47 | |||
| Conservatives | 5,062 | 19.31 | -3.70 | |||
| Venstre | 3,902 | 14.88 | +4.59 | |||
| Progress Party | 2,171 | 8.28 | -2.05 | |||
| Green Left | 1,242 | 4.74 | -3.55 | |||
| Centre Democrats | 1,103 | 4.21 | +0.20 | |||
| Social Liberals | 722 | 2.75 | -2.19 | |||
| Christian People's Party | 482 | 1.84 | +0.17 | |||
| Common Course | 329 | 1.25 | -0.49 | |||
| The Greens | 230 | 0.88 | -0.33 | |||
| Justice Party of Denmark | 208 | 0.79 | New | |||
| Red–Green Alliance | 183 | 0.70 | New | |||
| Total | 26,217 | |||||
| Source[18] | ||||||
General elections in the 1980s
| Parties | Vote | |||||
|---|---|---|---|---|---|---|
| Votes | % | + / - | ||||
| Social Democrats | 9,093 | 33.90 | -0.07 | |||
| Conservatives | 6,172 | 23.01 | -2.70 | |||
| Progress Party | 2,770 | 10.33 | +4.51 | |||
| Venstre | 2,759 | 10.29 | +2.01 | |||
| Green Left | 2,223 | 8.29 | -1.93 | |||
| Social Liberals | 1,325 | 4.94 | -0.52 | |||
| Centre Democrats | 1,076 | 4.01 | +0.33 | |||
| Common Course | 466 | 1.74 | -0.05 | |||
| Christian People's Party | 449 | 1.67 | -0.35 | |||
| The Greens | 325 | 1.21 | -0.20 | |||
| Communist Party of Denmark | 110 | 0.41 | -0.05 | |||
| Left Socialists | 56 | 0.21 | -0.24 | |||
| Total | 26,824 | |||||
| Source[19] | ||||||
| Parties | Vote | |||||
|---|---|---|---|---|---|---|
| Votes | % | + / - | ||||
| Social Democrats | 9,128 | 33.97 | -2.24 | |||
| Conservatives | 6,908 | 25.71 | -3.38 | |||
| Green Left | 2,745 | 10.22 | +2.58 | |||
| Venstre | 2,226 | 8.28 | -0.86 | |||
| Progress Party | 1,565 | 5.82 | +1.66 | |||
| Social Liberals | 1,468 | 5.46 | +1.00 | |||
| Centre Democrats | 988 | 3.68 | -0.42 | |||
| Christian People's Party | 542 | 2.02 | -0.31 | |||
| Common Course | 482 | 1.79 | New | |||
| The Greens | 378 | 1.41 | New | |||
| Justice Party of Denmark | 143 | 0.53 | -0.83 | |||
| Communist Party of Denmark | 124 | 0.46 | +0.14 | |||
| Left Socialists | 122 | 0.45 | -0.64 | |||
| Humanist Party | 27 | 0.10 | New | |||
| Socialist Workers Party | 19 | 0.07 | -0.01 | |||
| Marxist–Leninists Party | 5 | 0.02 | -0.01 | |||
| Total | 26,870 | |||||
| Source[20] | ||||||
| Parties | Vote | |||||
|---|---|---|---|---|---|---|
| Votes | % | + / - | ||||
| Social Democrats | 9,614 | 36.21 | -3.61 | |||
| Conservatives | 7,722 | 29.09 | +11.90 | |||
| Venstre | 2,427 | 9.14 | +0.29 | |||
| Green Left | 2,027 | 7.64 | +0.32 | |||
| Social Liberals | 1,185 | 4.46 | +0.20 | |||
| Progress Party | 1,104 | 4.16 | -6.21 | |||
| Centre Democrats | 1,088 | 4.10 | -3.06 | |||
| Christian People's Party | 619 | 2.33 | +0.47 | |||
| Justice Party of Denmark | 360 | 1.36 | -0.24 | |||
| Left Socialists | 290 | 1.09 | +0.20 | |||
| Communist Party of Denmark | 85 | 0.32 | -0.12 | |||
| Socialist Workers Party | 20 | 0.08 | -0.05 | |||
| Marxist–Leninists Party | 7 | 0.03 | New | |||
| Total | 26,548 | |||||
| Source[21] | ||||||
| Parties | Vote | |||||
|---|---|---|---|---|---|---|
| Votes | % | + / - | ||||
| Social Democrats | 9,900 | 39.82 | -5.28 | |||
| Conservatives | 4,275 | 17.19 | +3.52 | |||
| Progress Party | 2,577 | 10.37 | -3.23 | |||
| Venstre | 2,201 | 8.85 | -1.11 | |||
| Green Left | 1,820 | 7.32 | +3.62 | |||
| Centre Democrats | 1,779 | 7.16 | +4.28 | |||
| Social Liberals | 1,059 | 4.26 | +0.46 | |||
| Christian People's Party | 462 | 1.86 | -0.46 | |||
| Justice Party of Denmark | 397 | 1.60 | -0.95 | |||
| Left Socialists | 221 | 0.89 | -0.40 | |||
| Communist Party of Denmark | 110 | 0.44 | -0.52 | |||
| Socialist Workers Party | 32 | 0.13 | New | |||
| Communist Workers Party | 29 | 0.12 | -0.04 | |||
| Total | 24,862 | |||||
| Source[22] | ||||||
General elections in the 1970s
| Parties | Vote | |||||
|---|---|---|---|---|---|---|
| Votes | % | + / - | ||||
| Social Democrats | 11,061 | 45.10 | +3.91 | |||
| Conservatives | 3,352 | 13.67 | +4.24 | |||
| Progress Party | 3,336 | 13.60 | -4.12 | |||
| Venstre | 2,443 | 9.96 | +1.06 | |||
| Social Liberals | 932 | 3.80 | +1.13 | |||
| Green Left | 907 | 3.70 | +1.39 | |||
| Centre Democrats | 706 | 2.88 | -4.59 | |||
| Justice Party of Denmark | 626 | 2.55 | -0.94 | |||
| Christian People's Party | 570 | 2.32 | -0.95 | |||
| Left Socialists | 317 | 1.29 | +0.36 | |||
| Communist Party of Denmark | 235 | 0.96 | -0.75 | |||
| Communist Workers Party | 39 | 0.16 | New | |||
| Total | 24,524 | |||||
| Source[23] | ||||||
| Parties | Vote | |||||
|---|---|---|---|---|---|---|
| Votes | % | + / - | ||||
| Social Democrats | 10,161 | 41.19 | +6.14 | |||
| Progress Party | 4,372 | 17.72 | +0.73 | |||
| Conservatives | 2,326 | 9.43 | +2.97 | |||
| Venstre | 2,196 | 8.90 | -11.31 | |||
| Centre Democrats | 1,843 | 7.47 | +3.49 | |||
| Justice Party of Denmark | 862 | 3.49 | +1.66 | |||
| Christian People's Party | 806 | 3.27 | -1.27 | |||
| Social Liberals | 659 | 2.67 | -3.02 | |||
| Green Left | 570 | 2.31 | -0.37 | |||
| Communist Party of Denmark | 423 | 1.71 | -0.12 | |||
| Left Socialists | 230 | 0.93 | +0.23 | |||
| Pensioners' Party | 218 | 0.88 | New | |||
| Total | 24,666 | |||||
| Source[24] | ||||||
| Parties | Vote | |||||
|---|---|---|---|---|---|---|
| Votes | % | + / - | ||||
| Social Democrats | 8,543 | 35.05 | +3.06 | |||
| Venstre | 4,925 | 20.21 | +12.74 | |||
| Progress Party | 4,142 | 16.99 | -1.39 | |||
| Conservatives | 1,574 | 6.46 | -5.66 | |||
| Social Liberals | 1,388 | 5.69 | -4.72 | |||
| Christian People's Party | 1,106 | 4.54 | +0.78 | |||
| Centre Democrats | 969 | 3.98 | -3.30 | |||
| Green Left | 653 | 2.68 | -0.94 | |||
| Justice Party of Denmark | 446 | 1.83 | -1.18 | |||
| Communist Party of Denmark | 446 | 1.83 | +0.54 | |||
| Left Socialists | 171 | 0.70 | +0.14 | |||
| Marinus Roth | 11 | 0.05 | -0.06 | |||
| Total | 24,374 | |||||
| Source[25] | ||||||
| Parties | Vote | |||||
|---|---|---|---|---|---|---|
| Votes | % | + / - | ||||
| Social Democrats | 7,760 | 31.99 | -13.32 | |||
| Progress Party | 4,458 | 18.38 | New | |||
| Conservatives | 2,939 | 12.12 | -9.08 | |||
| Social Liberals | 2,526 | 10.41 | -1.04 | |||
| Venstre | 1,813 | 7.47 | -0.69 | |||
| Centre Democrats | 1,767 | 7.28 | New | |||
| Christian People's Party | 913 | 3.76 | +2.13 | |||
| Green Left | 877 | 3.62 | -1.84 | |||
| Justice Party of Denmark | 731 | 3.01 | +1.49 | |||
| Communist Party of Denmark | 314 | 1.29 | +0.97 | |||
| Left Socialists | 135 | 0.56 | -0.06 | |||
| Marinus Roth | 26 | 0.11 | +0.08 | |||
| Total | 24,259 | |||||
| Source[26] | ||||||
| Parties | Vote | |||||
|---|---|---|---|---|---|---|
| Votes | % | + / - | ||||
| Social Democrats | 10,601 | 45.31 | -1.10 | |||
| Conservatives | 4,959 | 21.20 | -4.01 | |||
| Social Liberals | 2,678 | 11.45 | +0.42 | |||
| Venstre | 1,910 | 8.16 | +2.27 | |||
| Green Left | 1,277 | 5.46 | +2.30 | |||
| Schleswig Party | 1,007 | 4.30 | -0.86 | |||
| Christian People's Party | 382 | 1.63 | New | |||
| Justice Party of Denmark | 356 | 1.52 | +0.89 | |||
| Left Socialists | 144 | 0.62 | +0.27 | |||
| Communist Party of Denmark | 76 | 0.32 | -0.11 | |||
| Marinus Roth | 6 | 0.03 | New | |||
| Total | 23,396 | |||||
| Source[27] | ||||||
General elections in the 1960s
| Parties | Vote | |||||
|---|---|---|---|---|---|---|
| Votes | % | + / - | ||||
| Social Democrats | 10,015 | 46.41 | -5.49 | |||
| Conservatives | 5,441 | 25.21 | +0.72 | |||
| Social Liberals | 2,380 | 11.03 | +7.01 | |||
| Venstre | 1,270 | 5.89 | -4.51 | |||
| Schleswig Party | 1,114 | 5.16 | New | |||
| Green Left | 681 | 3.16 | -1.22 | |||
| Liberal Centre | 297 | 1.38 | -1.10 | |||
| Justice Party of Denmark | 136 | 0.63 | +0.01 | |||
| Communist Party of Denmark | 93 | 0.43 | +0.18 | |||
| Independent Party | 76 | 0.35 | -1.11 | |||
| Left Socialists | 76 | 0.35 | New | |||
| Total | 21,579 | |||||
| Source[28] | ||||||
| Parties | Vote | |||||
|---|---|---|---|---|---|---|
| Votes | % | + / - | ||||
| Social Democrats | 11,374 | 51.90 | +2.49 | |||
| Conservatives | 5,368 | 24.49 | -0.20 | |||
| Venstre | 2,279 | 10.40 | +0.93 | |||
| Green Left | 959 | 4.38 | +2.20 | |||
| Social Liberals | 882 | 4.02 | +1.43 | |||
| Liberal Centre | 543 | 2.48 | New | |||
| Independent Party | 320 | 1.46 | -0.59 | |||
| Justice Party of Denmark | 136 | 0.62 | -0.49 | |||
| Communist Party of Denmark | 55 | 0.25 | -0.16 | |||
| Total | 21,916 | |||||
| Source[29] | ||||||
| Parties | Vote | |||||
|---|---|---|---|---|---|---|
| Votes | % | + / - | ||||
| Social Democrats | 10,216 | 49.41 | -0.44 | |||
| Conservatives | 5,104 | 24.69 | +3.58 | |||
| Venstre | 1,959 | 9.47 | -0.64 | |||
| Schleswig Party | 1,566 | 7.57 | -1.06 | |||
| Social Liberals | 535 | 2.59 | -0.32 | |||
| Green Left | 450 | 2.18 | -0.11 | |||
| Independent Party | 423 | 2.05 | -0.87 | |||
| Justice Party of Denmark | 229 | 1.11 | -0.55 | |||
| Danish Unity | 109 | 0.53 | New | |||
| Communist Party of Denmark | 85 | 0.41 | -0.11 | |||
| Total | 20,676 | |||||
| Source[30] | ||||||
| Parties | Vote | |||||
|---|---|---|---|---|---|---|
| Votes | % | + / - | ||||
| Social Democrats | 8,726 | 49.85 | +4.79 | |||
| Conservatives | 3,695 | 21.11 | +1.22 | |||
| Venstre | 1,770 | 10.11 | -2.26 | |||
| Schleswig Party | 1,510 | 8.63 | -1.33 | |||
| Independent Party | 511 | 2.92 | +1.04 | |||
| Social Liberals | 509 | 2.91 | -1.51 | |||
| Green Left | 401 | 2.29 | New | |||
| Justice Party of Denmark | 290 | 1.66 | -3.11 | |||
| Communist Party of Denmark | 91 | 0.52 | -1.14 | |||
| Total | 17,503 | |||||
| Source[31] | ||||||
General elections in the 1950s
| Parties | Vote | |||||
|---|---|---|---|---|---|---|
| Votes | % | + / - | ||||
| Social Democrats | 7,376 | 45.06 | -1.73 | |||
| Conservatives | 3,255 | 19.89 | -1.45 | |||
| Venstre | 2,025 | 12.37 | +1.74 | |||
| Schleswig Party | 1,631 | 9.96 | New | |||
| Justice Party of Denmark | 781 | 4.77 | +1.67 | |||
| Social Liberals | 723 | 4.42 | +0.43 | |||
| Independent Party | 307 | 1.88 | +0.69 | |||
| Communist Party of Denmark | 271 | 1.66 | -0.35 | |||
| Total | 16,369 | |||||
| Source[32] | ||||||
September 1953 Danish Folketing election
| Parties | Vote | |||||
|---|---|---|---|---|---|---|
| Votes | % | + / - | ||||
| Social Democrats | 7,208 | 46.79 | +0.51 | |||
| Conservatives | 3,287 | 21.34 | -0.56 | |||
| Hans Schmidt | 1,686 | 10.95 | +0.46 | |||
| Venstre | 1,637 | 10.63 | +0.96 | |||
| Social Liberals | 615 | 3.99 | +0.19 | |||
| Justice Party of Denmark | 478 | 3.10 | -1.54 | |||
| Communist Party of Denmark | 310 | 2.01 | -0.22 | |||
| Independent Party | 183 | 1.19 | New | |||
| Total | 15,404 | |||||
| Source[33] | ||||||
April 1953 Danish Folketing election
| Parties | Vote | |||||
|---|---|---|---|---|---|---|
| Votes | % | + / - | ||||
| Social Democrats | 6,818 | 46.28 | -1.19 | |||
| Conservatives | 3,226 | 21.90 | -1.12 | |||
| Hans Schmidt | 1,546 | 10.49 | +2.45 | |||
| Venstre | 1,424 | 9.67 | +1.12 | |||
| Justice Party of Denmark | 684 | 4.64 | -2.22 | |||
| Social Liberals | 560 | 3.80 | +0.57 | |||
| Communist Party of Denmark | 328 | 2.23 | -0.61 | |||
| Danish Unity | 145 | 0.98 | New | |||
| Total | 14,731 | |||||
| Source[34] | ||||||
1950 Danish Folketing election
| Parties | Vote | |||||
|---|---|---|---|---|---|---|
| Votes | % | + / - | ||||
| Social Democrats | 6,763 | 47.47 | +1.09 | |||
| Conservatives | 3,280 | 23.02 | +6.91 | |||
| Venstre | 1,218 | 8.55 | -2.79 | |||
| Hans Schmidt | 1,145 | 8.04 | New | |||
| Justice Party of Denmark | 978 | 6.86 | +3.56 | |||
| Social Liberals | 460 | 3.23 | +1.06 | |||
| Communist Party of Denmark | 404 | 2.84 | -1.28 | |||
| Total | 14,248 | |||||
| Source[35] | ||||||
General elections in the 1940s
1947 Danish Folketing election
| Parties | Vote | |||||
|---|---|---|---|---|---|---|
| Votes | % | + / - | ||||
| Social Democrats | 6,587 | 46.38 | -2.69 | |||
| Conservatives | 2,288 | 16.11 | -8.08 | |||
| Venstre | 1,611 | 11.34 | -4.65 | |||
| W. Reuter | 1,532 | 10.79 | New | |||
| J. Christmas Møller | 590 | 4.15 | New | |||
| Communist Party of Denmark | 585 | 4.12 | -2.23 | |||
| Justice Party of Denmark | 468 | 3.30 | +1.86 | |||
| Social Liberals | 308 | 2.17 | -0.78 | |||
| Danish Unity | 232 | 1.63 | +1.63 | |||
| Total | 14,201 | |||||
| Source[36] | ||||||
1945 Danish Folketing election
| Parties | Vote | |||||
|---|---|---|---|---|---|---|
| Votes | % | + / - | ||||
| Social Democrats | 6,230 | 49.07 | -5.10 | |||
| Conservatives | 3,071 | 24.19 | -0.92 | |||
| Venstre | 2,030 | 15.99 | +7.97 | |||
| Communist Party of Denmark | 806 | 6.35 | New | |||
| Social Liberals | 375 | 2.95 | +0.14 | |||
| Justice Party of Denmark | 183 | 1.44 | +0.35 | |||
| Danish Unity | 0 | 0.00 | -1.92 | |||
| Total | 12,695 | |||||
| Source[37] | ||||||
1943 Danish Folketing election
| Parties | Vote | |||||
|---|---|---|---|---|---|---|
| Votes | % | + / - | ||||
| Social Democrats | 6,528 | 54.17 | +10.55 | |||
| Conservatives | 3,026 | 25.11 | +3.69 | |||
| Venstre | 966 | 8.02 | +0.57 | |||
| National Socialist Workers' Party of Denmark | 776 | 6.44 | +2.49 | |||
| Social Liberals | 339 | 2.81 | -0.12 | |||
| Danish Unity | 231 | 1.92 | New | |||
| Justice Party of Denmark | 131 | 1.09 | +0.16 | |||
| Farmers' Party | 54 | 0.45 | New | |||
| Total | 12,051 | |||||
| Source[38] | ||||||
General elections in the 1930s
1939 Danish Folketing election
| Parties | Vote | |||||
|---|---|---|---|---|---|---|
| Votes | % | + / - | ||||
| Social Democrats | 5,940 | 43.62 | -0.20 | |||
| Conservatives | 2,917 | 21.42 | +0.33 | |||
| Schleswig Party | 2,572 | 18.89 | +1.50 | |||
| Venstre | 1,014 | 7.45 | +0.83 | |||
| National Socialist Workers' Party of Denmark | 538 | 3.95 | +1.08 | |||
| Social Liberals | 399 | 2.93 | +0.10 | |||
| Justice Party of Denmark | 126 | 0.93 | -0.69 | |||
| National Cooperation | 112 | 0.82 | New | |||
| Total | 13,618 | |||||
| Source[39] | ||||||
1935 Danish Folketing election
| Parties | Vote | |||||
|---|---|---|---|---|---|---|
| Votes | % | + / - | ||||
| Social Democrats | 5,232 | 43.82 | +0.84 | |||
| Conservatives | 2,518 | 21.09 | -3.93 | |||
| Schleswig Party | 2,076 | 17.39 | +2.27 | |||
| Venstre | 790 | 6.62 | -2.18 | |||
| National Socialist Workers' Party of Denmark | 343 | 2.87 | New | |||
| Social Liberals | 338 | 2.83 | -0.41 | |||
| Communist Party of Denmark | 235 | 1.97 | -1.08 | |||
| Independent People's Party | 197 | 1.65 | New | |||
| Justice Party of Denmark | 194 | 1.62 | -0.18 | |||
| Society Party | 16 | 0.13 | New | |||
| Total | 11,939 | |||||
| Source[40] | ||||||
1932 Danish Folketing election
| Parties | Vote | |||||
|---|---|---|---|---|---|---|
| Votes | % | + / - | ||||
| Social Democrats | 4,500 | 42.98 | +0.58 | |||
| Conservatives | 2,620 | 25.02 | +8.44 | |||
| Schleswig Party | 1,583 | 15.12 | -1.14 | |||
| Venstre | 921 | 8.80 | -8.09 | |||
| Social Liberals | 339 | 3.24 | -1.41 | |||
| Communist Party of Denmark | 319 | 3.05 | +1.60 | |||
| Justice Party of Denmark | 188 | 1.80 | +0.03 | |||
| Total | 10,470 | |||||
| Source[41] | ||||||
General elections in the 1920s
1929 Danish Folketing election
| Parties | Vote | |||||
|---|---|---|---|---|---|---|
| Votes | % | + / - | ||||
| Social Democrats | 4,121 | 42.40 | +4.77 | |||
| Venstre | 1,642 | 16.89 | +1.45 | |||
| Conservatives | 1,612 | 16.58 | -2.68 | |||
| Schleswig Party | 1,580 | 16.26 | -2.34 | |||
| Social Liberals | 452 | 4.65 | -0.28 | |||
| Justice Party of Denmark | 172 | 1.77 | +1.12 | |||
| Communist Party of Denmark | 141 | 1.45 | +0.59 | |||
| Total | 9,720 | |||||
| Source[42] | ||||||
1926 Danish Folketing election
| Parties | Vote | |||||
|---|---|---|---|---|---|---|
| Votes | % | + / - | ||||
| Social Democrats | 3,659 | 37.63 | +1.47 | |||
| Conservatives | 1,873 | 19.26 | +0.73 | |||
| Schleswig Party | 1,809 | 18.60 | +3.02 | |||
| Venstre | 1,501 | 15.44 | -0.20 | |||
| Social Liberals | 479 | 4.93 | -5.71 | |||
| Independence Party | 256 | 2.63 | New | |||
| Communist Party of Denmark | 84 | 0.86 | New | |||
| Justice Party of Denmark | 63 | 0.65 | +0.53 | |||
| Total | 9,724 | |||||
| Source[43] | ||||||
1924 Danish Folketing election
| Parties | Vote | |||||
|---|---|---|---|---|---|---|
| Votes | % | + / - | ||||
| Social Democrats | 3,015 | 36.16 | +10.10 | |||
| Conservatives | 1,545 | 18.53 | +5.34 | |||
| Venstre | 1,304 | 15.64 | -17.70 | |||
| Schleswig Party | 1,299 | 15.58 | -3.84 | |||
| Social Liberals | 887 | 10.64 | +6.84 | |||
| Farmer Party | 278 | 3.33 | New | |||
| Justice Party of Denmark | 10 | 0.12 | New | |||
| Total | 8,338 | |||||
| Source[44] | ||||||
September 1920 Danish Folketing election
| Parties | Vote | |||||
|---|---|---|---|---|---|---|
| Votes | % | + / - | ||||
| Venstre | 2,134 | 33.34 | ||||
| Social Democrats | 1,668 | 26.06 | ||||
| Schleswig Party | 1,243 | 19.42 | ||||
| Conservatives | 844 | 13.19 | ||||
| Social Liberals | 243 | 3.80 | ||||
| Industry Party | 145 | 2.27 | ||||
| Danish Left Socialist Party | 124 | 1.94 | ||||
| Total | 6,401 | |||||
| Source[45] | ||||||
European Parliament elections results
2019 European Parliament election in Denmark
| Parties | Vote | |||||
|---|---|---|---|---|---|---|
| Votes | % | + / - | ||||
| Social Democrats | 8,743 | 25.48 | +5.18 | |||
| Venstre | 8,680 | 25.30 | +5.34 | |||
| Danish People's Party | 5,743 | 16.74 | -17.17 | |||
| Green Left | 2,730 | 7.96 | +2.28 | |||
| Social Liberals | 2,624 | 7.65 | +3.76 | |||
| Conservatives | 1,701 | 4.96 | -3.52 | |||
| People's Movement against the EU | 1,258 | 3.67 | -1.68 | |||
| Liberal Alliance | 1,106 | 3.22 | +0.79 | |||
| Red–Green Alliance | 1,028 | 3.00 | New | |||
| The Alternative | 697 | 2.03 | New | |||
| Total | 34,310 | |||||
| Source[46] | ||||||
2014 European Parliament election in Denmark
| Parties | Vote | |||||
|---|---|---|---|---|---|---|
| Votes | % | + / - | ||||
| Danish People's Party | 10,119 | 33.91 | +13.33 | |||
| Social Democrats | 6,057 | 20.30 | -2.55 | |||
| Venstre | 5,957 | 19.96 | -3.34 | |||
| Conservatives | 2,532 | 8.48 | -3.45 | |||
| Green Left | 1,694 | 5.68 | -4.84 | |||
| People's Movement against the EU | 1,598 | 5.35 | +0.04 | |||
| Social Liberals | 1,162 | 3.89 | +0.93 | |||
| Liberal Alliance | 725 | 2.43 | +1.88 | |||
| Total | 29,844 | |||||
| Source[47] | ||||||
2009 European Parliament election in Denmark
| Parties | Vote | |||||
|---|---|---|---|---|---|---|
| Votes | % | + / - | ||||
| Venstre | 7,422 | 23.30 | +3.50 | |||
| Social Democrats | 7,279 | 22.85 | -15.20 | |||
| Danish People's Party | 6,557 | 20.58 | +12.01 | |||
| Conservatives | 3,800 | 11.93 | +0.70 | |||
| Green Left | 3,351 | 10.52 | +5.73 | |||
| People's Movement against the EU | 1,692 | 5.31 | +1.49 | |||
| Social Liberals | 942 | 2.96 | -1.17 | |||
| June Movement | 636 | 2.00 | -6.60 | |||
| Liberal Alliance | 175 | 0.55 | New | |||
| Total | 31,854 | |||||
| Source[48] | ||||||
2004 European Parliament election in Denmark
| Parties | Vote | |||||
|---|---|---|---|---|---|---|
| Votes | % | + / - | ||||
| Social Democrats | 5,622 | 38.05 | +21.14 | |||
| Venstre | 2,925 | 19.80 | -3.01 | |||
| Conservatives | 1,659 | 11.23 | -0.78 | |||
| June Movement | 1,270 | 8.60 | -6.54 | |||
| Danish People's Party | 1,266 | 8.57 | +0.70 | |||
| Green Left | 708 | 4.79 | +0.10 | |||
| Social Liberals | 610 | 4.13 | -4.47 | |||
| People's Movement against the EU | 565 | 3.82 | -3.13 | |||
| Christian Democrats | 150 | 1.02 | -0.86 | |||
| Total | 14,775 | |||||
| Source[49] | ||||||
1999 European Parliament election in Denmark
| Parties | Vote | |||||
|---|---|---|---|---|---|---|
| Votes | % | + / - | ||||
| Venstre | 3,467 | 22.81 | +4.03 | |||
| Social Democrats | 2,571 | 16.91 | -1.82 | |||
| June Movement | 2,301 | 15.14 | +2.56 | |||
| Conservatives | 1,826 | 12.01 | -10.67 | |||
| Social Liberals | 1,308 | 8.60 | +2.66 | |||
| Danish People's Party | 1,196 | 7.87 | New | |||
| People's Movement against the EU | 1,057 | 6.95 | -4.27 | |||
| Green Left | 713 | 4.69 | -0.77 | |||
| Centre Democrats | 477 | 3.14 | +2.45 | |||
| Christian Democrats | 286 | 1.88 | +0.96 | |||
| Progress Party | 202 | 1.33 | -1.66 | |||
| Total | 15,202 | |||||
| Source[50] | ||||||
1994 European Parliament election in Denmark
| Parties | Vote | |||||
|---|---|---|---|---|---|---|
| Votes | % | + / - | ||||
| Conservatives | 3,824 | 22.68 | +5.85 | |||
| Venstre | 3,166 | 18.78 | +3.57 | |||
| Social Democrats | 3,158 | 18.73 | -8.95 | |||
| June Movement | 2,121 | 12.58 | New | |||
| People's Movement against the EU | 1,891 | 11.22 | -5.08 | |||
| Social Liberals | 1,002 | 5.94 | +3.59 | |||
| Green Left | 920 | 5.46 | +0.33 | |||
| Progress Party | 504 | 2.99 | -3.77 | |||
| Christian Democrats | 155 | 0.92 | -1.47 | |||
| Centre Democrats | 116 | 0.69 | -6.65 | |||
| Total | 16,857 | |||||
| Source[51] | ||||||
1989 European Parliament election in Denmark
| Parties | Vote | |||||
|---|---|---|---|---|---|---|
| Votes | % | + / - | ||||
| Social Democrats | 3,879 | 27.68 | +2.31 | |||
| Conservatives | 2,359 | 16.83 | -10.17 | |||
| People's Movement against the EU | 2,285 | 16.30 | -1.82 | |||
| Venstre | 2,132 | 15.21 | +6.84 | |||
| Centre Democrats | 1,029 | 7.34 | +0.37 | |||
| Progress Party | 948 | 6.76 | +3.31 | |||
| Green Left | 719 | 5.13 | -0.01 | |||
| Christian Democrats | 335 | 2.39 | +0.01 | |||
| Social Liberals | 330 | 2.35 | -0.40 | |||
| Total | 14,016 | |||||
| Source[52] | ||||||
1984 European Parliament election in Denmark
| Parties | Vote | |||||
|---|---|---|---|---|---|---|
| Votes | % | |||||
| Conservatives | 4,190 | 27.00 | ||||
| Social Democrats | 3,936 | 25.37 | ||||
| People's Movement against the EU | 2,812 | 18.12 | ||||
| Venstre | 1,299 | 8.37 | ||||
| Centre Democrats | 1,082 | 6.97 | ||||
| Green Left | 798 | 5.14 | ||||
| Progress Party | 535 | 3.45 | ||||
| Social Liberals | 426 | 2.75 | ||||
| Christian Democrats | 369 | 2.38 | ||||
| Left Socialists | 69 | 0.44 | ||||
| Total | 15,516 | |||||
| Source[53] | ||||||
Referendums
2022 Danish European Union opt-out referendum[54]
| Option | Votes | % |
|---|---|---|
| ✓ YES | 22,352 | 63.49 |
| X NO | 12,853 | 36.51 |
2015 Danish European Union opt-out referendum[55]
| Option | Votes | % |
|---|---|---|
| X NO | 21,904 | 55.60 |
| ✓ YES | 17,489 | 44.40 |
2014 Danish Unified Patent Court membership referendum[56]
| Option | Votes | % |
|---|---|---|
| ✓ YES | 19,223 | 65.59 |
| X NO | 10,084 | 34.41 |
2009 Danish Act of Succession referendum[57]
| Option | Votes | % |
|---|---|---|
| ✓ YES | 25,617 | 84.53 |
| X NO | 4,687 | 15.47 |
2000 Danish euro referendum[58]
| Option | Votes | % |
|---|---|---|
| X NO | 14,400 | 51.19 |
| ✓ YES | 13,729 | 48.81 |
1998 Danish Amsterdam Treaty referendum[59]
| Option | Votes | % |
|---|---|---|
| ✓ YES | 14,029 | 55.37 |
| X NO | 11,310 | 44.63 |
1993 Danish Maastricht Treaty referendum[60]
| Option | Votes | % |
|---|---|---|
| ✓ YES | 16,836 | 60.03 |
| X NO | 11,209 | 39.97 |
1992 Danish Maastricht Treaty referendum[61]
| Option | Votes | % |
|---|---|---|
| ✓ YES | 13,962 | 52.06 |
| X NO | 12,855 | 47.94 |
1986 Danish Single European Act referendum[62]
| Option | Votes | % |
|---|---|---|
| ✓ YES | 14,259 | 61.24 |
| X NO | 9,023 | 38.76 |
1972 Danish European Communities membership referendum[63]
| Option | Votes | % |
|---|---|---|
| ✓ YES | 17,545 | 70.87 |
| X NO | 7,212 | 29.13 |
1953 Danish constitutional and electoral age referendum[64]
| Option | Votes | % |
|---|---|---|
| ✓ YES | 9,630 | 86.52 |
| X NO | 1,500 | 13.48 |
| 23 years | 5,928 | 51.91 |
| 21 years | 5,492 | 48.09 |
1939 Danish constitutional referendum[65]
| Option | Votes | % |
|---|---|---|
| ✓ YES | 7,120 | 94.17 |
| X NO | 441 | 5.83 |
References
- "Sønderborgkredsen". kmdvalg.dk (in Danish). Retrieved 2023-06-04.
- "Forslag til Lov om de sønderjyske Landsdeles Repræsentation i Rigsdagen m.v.". Rigsdagstidende. 1919-20 (anden samling): Tillæg C, spalte 25 ff.
- "Nye valgkredse fordeler stemmerne anderledes". dr.dk (in Danish). Retrieved 2023-06-04.
- "Beretning om nye valgkredse som følge af kommunalreformen" (in Danish). Retrieved 2023-06-04.
- "Det danske valgsystem: Valg til Folketinget". valg.im (in Danish). Retrieved 2023-06-04.
- "49 Sønderborg". dataforsyningen.dk (in Danish). Retrieved 2023-06-04.
- "Forslag til Lov om de sønderjyske Landsdeles Repræsentation i Rigsdagen m.v.". Rigsdagstidende. 1919-20 (anden samling): Tillæg C, spalte 25 ff.
- "Valgresultater fra tidligere valg:". kmdvalg (in Danish). Retrieved 2023-06-04.
- "FOLKETINGSVALG TIRSDAG 1. NOVEMBER 2022". valg.im (in Danish). Retrieved 2023-06-27.
- "FOLKETINGSVALG ONSDAG 5. JUNI 2019". valg.im (in Danish). Retrieved 2023-06-27.
- "FOLKETINGSVALG TORSDAG 18. JUNI 2015". valg.im (in Danish). Retrieved 2023-06-27.
- "FOLKETINGSVALG TORSDAG 15. SEPTEMBER 2011". valg.im (in Danish). Retrieved 2023-06-27.
- "Folketingsvalget den 13. november 2007". valg.im (in Danish). Retrieved 2023-06-27.
- "valg2005.book" (PDF). valg.im (in Danish). Retrieved 2023-06-27.
- "BMTABEL" (PDF). valg.im (in Danish). Retrieved 2023-06-27.
- "VALG98" (PDF). valg.im (in Danish). Retrieved 2023-06-27.
- "VALG94" (PDF). valg.im (in Danish). Retrieved 2023-06-27.
- "VALG90" (PDF). valg.im (in Danish). Retrieved 2023-06-27.
- "Folketingsvalget den 10. maj 1988". valg.im (in Danish). Retrieved 2023-06-27.
- "Folketingsvalget den 8.september 1987". dst.dk (in Danish). Retrieved 2023-06-27.
- "Folketingsvalget den 10. januar 1984". dst.dk (in Danish). Retrieved 2023-06-27.
- "Folketingsvalget den 8. december 1981". dst.dk (in Danish). Retrieved 2023-06-27.
- "Folketingsvalget den 23. oktober 1979". dst.dk (in Danish). Retrieved 2023-06-27.
- "Folketingsvalget den 15. februar 1977". dst.dk (in Danish). Retrieved 2023-06-27.
- "Folketingsvalget den 9. januar 1975". dst.dk (in Danish). Retrieved 2023-06-27.
- "Folketingsvalget den 4. december 1973". dst.dk (in Danish). Retrieved 2023-06-27.
- "Folketingsvalget den 21. september 1971 samt folkeafstemningen". dst.dk (in Danish). Retrieved 2023-06-27.
- "Folketingsvalget den 23. januar 1968". dst.dk (in Danish). Retrieved 2023-06-27.
- "Folketingsvalget den 22. november 1966". dst.dk (in Danish). Retrieved 2023-06-27.
- "Folketingsvalget den 22. september 1964". dst.dk (in Danish). Retrieved 2023-06-27.
- "Folketingsvalget den 15. november 1960". dst.dk (in Danish). Retrieved 2023-06-27.
- "Folketingsvalget den 14. maj 1957". dst.dk (in Danish). Retrieved 2023-06-27.
- "Folketingsvalget den 22. september 1953". dst.dk (in Danish). Retrieved 2023-06-27.
- "Rigsdagsvalgene og folkeafstemningerne i april og maj 1953". dst.dk (in Danish). Retrieved 2023-06-27.
- "Folketingsvalget den 5. september 1950". dst.dk (in Danish). Retrieved 2023-06-27.
- "Folketingsvalget den 28. oktober 1947". dst.dk (in Danish). Retrieved 2023-06-27.
- "Rigsdagsvalgene i oktober og november 1945". dst.dk (in Danish). Retrieved 2023-06-27.
- "Rigsdagsvalgene i marts og april 1943". dst.dk (in Danish). Retrieved 2023-06-27.
- "Rigsdagsvalgene og Folkeafstemningen i april og maj 1939". dst.dk (in Danish). Retrieved 2023-06-27.
- "Folketingsvalget den 22. oktober 1935". dst.dk (in Danish). Retrieved 2023-06-27.
- "Folketingsvalget den 16. november 1932". dst.dk (in Danish). Retrieved 2023-06-27.
- "Folketingsvalget den 24. april 1929". dst.dk (in Danish). Retrieved 2023-06-27.
- "Folketingsvalget den 2. december 1926". dst.dk (in Danish). Retrieved 2023-06-27.
- "Folketingsvalget den 11. april 1924". dst.dk (in Danish). Retrieved 2023-06-27.
- "Rigsdagsvalgene september-oktober 1920". dst.dk (in Danish). Retrieved 2023-06-27.
- "EUROPA-PARLAMENTSVALG SØNDAG 26. MAJ 2019". dst.dk (in Danish). Retrieved 2023-07-01.
- "EUROPA-PARLAMENTSVALG SØNDAG 25. MAJ 2014". dst.dk (in Danish). Retrieved 2023-07-01.
- "EUROPA-PARLAMENTSVALG SØNDAG 7. JUNI 2009". dst.dk (in Danish). Retrieved 2023-07-01.
- "EUROPA-PARLAMENTSVALGET DEN 13. JUNI 2004" (PDF). im.dk (in Danish). Retrieved 2023-07-01.
- "VALGET TIL EUROPA-PARLAMENTET DEN 10. JUNI 1999" (PDF). im.dk (in Danish). Retrieved 2023-07-01.
- "VALGET TIL EUROPA-PARLAMENTET DEN 9. JUNI 1994" (PDF). im.dk (in Danish). Retrieved 2023-07-01.
- "Valget til Europa-parlamentet den 15. juni 1989". dst.dk (in Danish). Retrieved 2023-07-01.
- "Valget til Europa-Parlamentet den 14. juni 1984". dst.dk (in Danish). Retrieved 2023-07-01.
- "FOLKEAFSTEMNING ONSDAG 1. JUNI 2022". dst.dk (in Danish). Retrieved 2023-07-05.
- "FOLKEAFSTEMNING TORSDAG 3. DECEMBER 2015". dst.dk (in Danish). Retrieved 2023-07-05.
- "FOLKEAFSTEMNING SØNDAG 25. MAJ 2014". dst.dk (in Danish). Retrieved 2023-07-05.
- "FOLKEAFSTEMNING SØNDAG 7. JUNI 2009". dst.dk (in Danish). Retrieved 2023-07-05.
- "FOLKEAFSTEMNINGEN DEN 28. SEPTEMBER 2000 OM DANMARKS DELTAGELSE I DEN FÆLLES VALUTA" (PDF). valg.im (in Danish). Retrieved 2023-07-05.
- "FOLKEAFSTEMNINGEN DEN 28. MAJ 1998OM DANMARKS TILTRÆDELSE AF AMSTERDAMTRAKTATEN" (PDF). valg.im (in Danish). Retrieved 2023-07-05.
- "FOLKEAFSTEMNINGEN DEN 18. MAJ 1993 OM DANMARKS TILTRÆDELSE AF EDINBURGH-AFGØRELSEN OG MAASTRICHT-TRAKTATEN". dst.dk (in Danish). Retrieved 2023-07-05.
- "Folkeafstemningen den 1. juni 1992 om Danmarks tiltrædelse af traktaten om Den Europæiske Union". dst.dk (in Danish). Retrieved 2023-07-05.
- "Vejledende folkeafstemning torsdag den 27. februar 1986 om Danmarks tiltrædelse af EF- pakken". dst.dk (in Danish). Retrieved 2023-07-05.
- "Folkeafstemningen om Danmarks tiltrædelse af De europæiske Fælleskaber 2. oktober 1972". dst.dk (in Danish). Retrieved 2023-07-05.
- "Publikationsfortegnelse vedrørende Folkeafstemninger". dst.dk (in Danish). Retrieved 2023-07-05.
- "Publikationsfortegnelse vedrørende Folkeafstemninger". dst.dk (in Danish). Retrieved 2023-07-05.