Saiki, Ōita
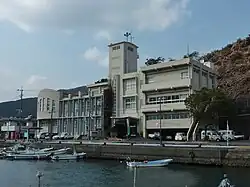
Saiki (佐伯市, Saiki-shi) is a city located in Ōita Prefecture, Japan on the eastern coast of the island of Kyushu. The city was founded on April 29, 1941.
Saiki
佐伯市 | |
|---|---|
 Saiki City | |
 Flag  Seal | |
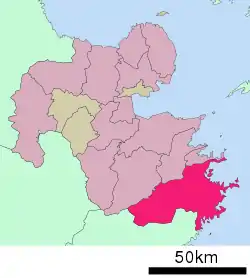 Location of Saiki in Ōita Prefecture | |
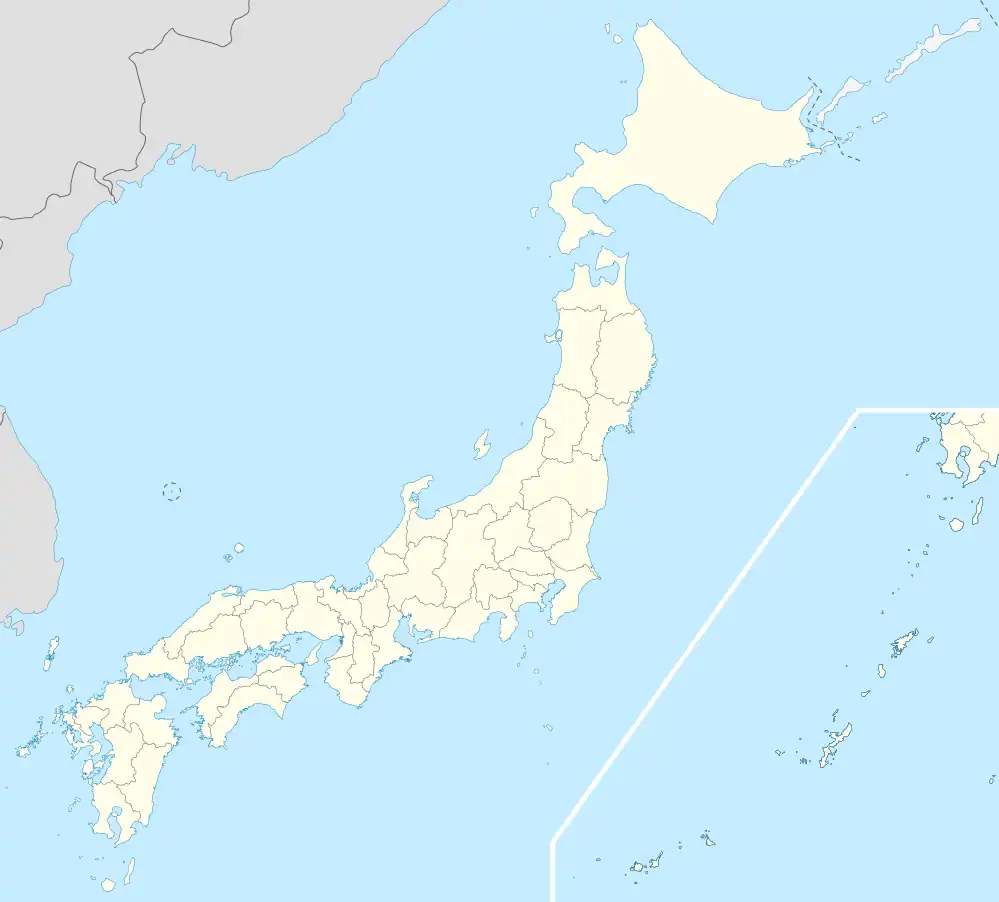 Saiki Location in Japan | |
| Coordinates: 32°58′N 131°54′E | |
| Country | Japan |
| Region | Kyushu |
| Prefecture | Ōita Prefecture |
| Government | |
| • Mayor | Yasuyoshi Nishijima |
| Area | |
| • Total | 903.44 km2 (348.82 sq mi) |
| Population (March 31, 2017) | |
| • Total | 73,546 |
| • Density | 81/km2 (210/sq mi) |
| Time zone | UTC+09:00 (JST) |
| City hall address | 1-1, Nakamura Minamimachi, Saiki-shi, Ōita-ken 876-8585 |
| Climate | Cfa |
| Website | www |
| Symbols | |
| Bird | Japanese white-eye |
| Fish | Sea: Aji River: Ayu |
| Flower | Yamazakura (Prunus jamasakura) |
| Tree | Oak |
On March 3, 2005, Saiki merged with the towns of Kamae, Kamiura, Tsurumi, Ume and Yayoi, and the villages Honjō, Naokawa and Yonōzu (all from Minamiamabe District) to create the new and expanded Saiki City. Minamiamabe District was dissolved as a result of this merger.
As of March 2017, the new city has an estimated population of 73,546 (former city, 2003: 49,183) and a population density of 81 persons per km2.[1] The total area is 903.44 km2, making it the largest city by area in Kyushu.
The small island Fukashima (深島) is one of Japan's cat islands.[2][3]
Geography
Climate
Saiki has a humid subtropical climate (Köppen climate classification Cfa) with hot summers and cool winters. Precipitation is significant throughout the year, but is somewhat lower in winter. The average annual temperature in Saiki is 16.7 °C (62.1 °F). The average annual rainfall is 2,118.9 mm (83.42 in) with September as the wettest month. The temperatures are highest on average in August, at around 27.3 °C (81.1 °F), and lowest in January, at around 6.7 °C (44.1 °F).[4] The highest temperature ever recorded in Saiki was 38.3 °C (100.9 °F) on 18 August 2020; the coldest temperature ever recorded was −10.5 °C (13.1 °F) on 11 February 1996.[5]
| Climate data for Saiki (1991−2020 normals, extremes 1977−present) | |||||||||||||
|---|---|---|---|---|---|---|---|---|---|---|---|---|---|
| Month | Jan | Feb | Mar | Apr | May | Jun | Jul | Aug | Sep | Oct | Nov | Dec | Year |
| Record high °C (°F) | 21.5 (70.7) |
23.5 (74.3) |
27.0 (80.6) |
28.7 (83.7) |
31.9 (89.4) |
34.8 (94.6) |
36.1 (97.0) |
36.6 (97.9) |
35.2 (95.4) |
31.9 (89.4) |
28.6 (83.5) |
24.3 (75.7) |
36.6 (97.9) |
| Average high °C (°F) | 11.0 (51.8) |
11.7 (53.1) |
14.9 (58.8) |
19.7 (67.5) |
23.7 (74.7) |
26.1 (79.0) |
30.1 (86.2) |
31.3 (88.3) |
27.9 (82.2) |
23.2 (73.8) |
18.2 (64.8) |
13.2 (55.8) |
20.9 (69.7) |
| Daily mean °C (°F) | 6.7 (44.1) |
7.5 (45.5) |
10.5 (50.9) |
15.1 (59.2) |
19.3 (66.7) |
22.4 (72.3) |
26.3 (79.3) |
27.3 (81.1) |
24.1 (75.4) |
19.1 (66.4) |
13.9 (57.0) |
8.7 (47.7) |
16.7 (62.1) |
| Average low °C (°F) | 2.5 (36.5) |
3.2 (37.8) |
6.1 (43.0) |
10.4 (50.7) |
15.0 (59.0) |
19.2 (66.6) |
23.2 (73.8) |
24.0 (75.2) |
20.9 (69.6) |
15.3 (59.5) |
9.7 (49.5) |
4.5 (40.1) |
12.8 (55.1) |
| Record low °C (°F) | −5.0 (23.0) |
−5.5 (22.1) |
−3.5 (25.7) |
1.3 (34.3) |
5.1 (41.2) |
11.5 (52.7) |
15.6 (60.1) |
17.0 (62.6) |
13.0 (55.4) |
5.4 (41.7) |
0.7 (33.3) |
−3.4 (25.9) |
−5.5 (22.1) |
| Average precipitation mm (inches) | 62.3 (2.45) |
70.9 (2.79) |
116.2 (4.57) |
136.8 (5.39) |
178.8 (7.04) |
333.3 (13.12) |
282.7 (11.13) |
247.2 (9.73) |
338.6 (13.33) |
200.6 (7.90) |
104.1 (4.10) |
60.1 (2.37) |
2,118.9 (83.42) |
| Average precipitation days (≥ 1.0 mm) | 5.3 | 7.2 | 9.6 | 9.8 | 10.1 | 14.5 | 12.1 | 11.0 | 11.3 | 7.5 | 7.0 | 5.2 | 110.6 |
| Mean monthly sunshine hours | 156.0 | 149.6 | 170.5 | 186.8 | 191.9 | 134.4 | 191.4 | 207.9 | 159.3 | 170.0 | 152.3 | 156.1 | 2,026.2 |
| Source: Japan Meteorological Agency[5][4] | |||||||||||||
| Climate data for Ume, Saiki (1991−2020 normals, extremes 1977−present) | |||||||||||||
|---|---|---|---|---|---|---|---|---|---|---|---|---|---|
| Month | Jan | Feb | Mar | Apr | May | Jun | Jul | Aug | Sep | Oct | Nov | Dec | Year |
| Record high °C (°F) | 21.7 (71.1) |
24.2 (75.6) |
28.4 (83.1) |
31.5 (88.7) |
34.0 (93.2) |
34.3 (93.7) |
37.3 (99.1) |
38.1 (100.6) |
34.6 (94.3) |
32.3 (90.1) |
26.9 (80.4) |
23.7 (74.7) |
38.1 (100.6) |
| Average high °C (°F) | 10.4 (50.7) |
11.8 (53.2) |
15.2 (59.4) |
20.3 (68.5) |
24.5 (76.1) |
26.4 (79.5) |
30.7 (87.3) |
31.3 (88.3) |
27.6 (81.7) |
22.9 (73.2) |
17.7 (63.9) |
12.5 (54.5) |
20.9 (69.7) |
| Daily mean °C (°F) | 3.9 (39.0) |
5.0 (41.0) |
8.3 (46.9) |
13.2 (55.8) |
17.7 (63.9) |
21.2 (70.2) |
25.2 (77.4) |
25.6 (78.1) |
22.1 (71.8) |
16.5 (61.7) |
10.9 (51.6) |
5.6 (42.1) |
14.6 (58.3) |
| Average low °C (°F) | −1.7 (28.9) |
−0.9 (30.4) |
2.1 (35.8) |
6.6 (43.9) |
11.8 (53.2) |
17.2 (63.0) |
21.4 (70.5) |
21.9 (71.4) |
18.1 (64.6) |
11.5 (52.7) |
5.3 (41.5) |
0.0 (32.0) |
9.4 (49.0) |
| Record low °C (°F) | −10.5 (13.1) |
−10.5 (13.1) |
−8.9 (16.0) |
−4.8 (23.4) |
−1.0 (30.2) |
6.1 (43.0) |
11.5 (52.7) |
13.4 (56.1) |
4.2 (39.6) |
−0.2 (31.6) |
−4.4 (24.1) |
−9.4 (15.1) |
−10.5 (13.1) |
| Average precipitation mm (inches) | 55.4 (2.18) |
69.6 (2.74) |
121.9 (4.80) |
142.0 (5.59) |
186.7 (7.35) |
368.9 (14.52) |
327.2 (12.88) |
347.9 (13.70) |
420.1 (16.54) |
198.0 (7.80) |
85.6 (3.37) |
58.6 (2.31) |
2,404.6 (94.67) |
| Average precipitation days (≥ 1.0 mm) | 5.2 | 7.4 | 10.0 | 9.8 | 10.3 | 14.9 | 12.5 | 13.2 | 12.6 | 8.0 | 6.7 | 5.4 | 116 |
| Mean monthly sunshine hours | 162.1 | 153.0 | 170.1 | 182.0 | 177.2 | 106.8 | 158.3 | 172.2 | 128.8 | 159.1 | 148.2 | 159.0 | 1,873.4 |
| Source: Japan Meteorological Agency[6][7] | |||||||||||||
| Climate data for Kamae, Saiki (1991−2020 normals, extremes 1977−present) | |||||||||||||
|---|---|---|---|---|---|---|---|---|---|---|---|---|---|
| Month | Jan | Feb | Mar | Apr | May | Jun | Jul | Aug | Sep | Oct | Nov | Dec | Year |
| Record high °C (°F) | 20.7 (69.3) |
22.1 (71.8) |
28.3 (82.9) |
27.9 (82.2) |
30.6 (87.1) |
32.9 (91.2) |
37.6 (99.7) |
38.3 (100.9) |
34.8 (94.6) |
30.6 (87.1) |
26.3 (79.3) |
22.4 (72.3) |
38.3 (100.9) |
| Average high °C (°F) | 11.8 (53.2) |
12.8 (55.0) |
15.7 (60.3) |
20.1 (68.2) |
23.8 (74.8) |
25.8 (78.4) |
29.3 (84.7) |
30.9 (87.6) |
28.5 (83.3) |
24.1 (75.4) |
19.0 (66.2) |
14.0 (57.2) |
21.3 (70.4) |
| Daily mean °C (°F) | 7.9 (46.2) |
8.6 (47.5) |
11.6 (52.9) |
15.9 (60.6) |
19.7 (67.5) |
22.4 (72.3) |
25.8 (78.4) |
27.2 (81.0) |
24.8 (76.6) |
20.2 (68.4) |
15.1 (59.2) |
10.0 (50.0) |
17.4 (63.4) |
| Average low °C (°F) | 4.3 (39.7) |
4.9 (40.8) |
7.6 (45.7) |
11.9 (53.4) |
16.0 (60.8) |
19.6 (67.3) |
23.2 (73.8) |
24.5 (76.1) |
21.9 (71.4) |
17.1 (62.8) |
11.7 (53.1) |
6.4 (43.5) |
14.1 (57.4) |
| Record low °C (°F) | −5.7 (21.7) |
−4.7 (23.5) |
−3.4 (25.9) |
2.0 (35.6) |
7.4 (45.3) |
11.8 (53.2) |
16.4 (61.5) |
17.9 (64.2) |
12.4 (54.3) |
5.5 (41.9) |
2.0 (35.6) |
−2.5 (27.5) |
−5.7 (21.7) |
| Average precipitation mm (inches) | 68.0 (2.68) |
75.4 (2.97) |
143.8 (5.66) |
187.5 (7.38) |
244.2 (9.61) |
398.6 (15.69) |
255.7 (10.07) |
230.9 (9.09) |
336.7 (13.26) |
190.0 (7.48) |
127.3 (5.01) |
74.5 (2.93) |
2,334.9 (91.93) |
| Average precipitation days (≥ 1.0 mm) | 5.4 | 6.6 | 9.5 | 9.5 | 10.2 | 15.1 | 11.7 | 11.1 | 11.7 | 7.6 | 6.5 | 5.1 | 110 |
| Mean monthly sunshine hours | 183.2 | 171.0 | 185.5 | 192.4 | 182.4 | 117.1 | 171.5 | 198.9 | 168.0 | 182.7 | 167.3 | 180.4 | 2,110.5 |
| Source: Japan Meteorological Agency[8][9] | |||||||||||||
Demographics
Per Japanese census data, the population of Saiki in 2020 is 66,851 people.[10] Saiki has been conducting censuses since 1920.
|
| |||||||||||||||||||||||||||||||||||||||||||||||||||||||||||||||||||||
| Saiki population statistics[10] | ||||||||||||||||||||||||||||||||||||||||||||||||||||||||||||||||||||||
Sport
During the 2002 World Cup, Saiki was the base camp for the Tunisia national football team.
Sister city
In the sister city program, Saiki is twinned with the Australian port city Gladstone, Queensland, as well as a sister city with Handan, China.[11]
References
- "Official website of Saiki city" (in Japanese). Japan: Saiki City. Retrieved 19 April 2017.
- City, Saiki. "猫のしま「深島」 時間をわすれ楽園で過ごす一日 | 観光スポット". 佐伯市観光ナビ (in Japanese). Retrieved 2023-03-21.
- Raising a Family on Cat Island - NHK WORLD PRIME - TV | NHK WORLD-JAPAN Live & Programs, retrieved 2023-03-21
- 気象庁 / 平年値(年・月ごとの値). JMA. Retrieved April 27, 2022.
- 観測史上1~10位の値(年間を通じての値). JMA. Retrieved April 27, 2022.
- 観測史上1~10位の値(年間を通じての値). JMA. Retrieved April 23, 2022.
- 気象庁 / 平年値(年・月ごとの値). JMA. Retrieved April 23, 2022.
- 観測史上1~10位の値(年間を通じての値). JMA. Retrieved April 27, 2022.
- 気象庁 / 平年値(年・月ごとの値). JMA. Retrieved April 27, 2022.
- Saiki population statistics
- "Home". hd.gov.cn.
External links
 Media related to Saiki, Ōita at Wikimedia Commons
- Saiki City official website (in Japanese)
| Core city | ||
|---|---|---|
| Cities | ||
| Districts | ||