San José de Gracia, Aguascalientes
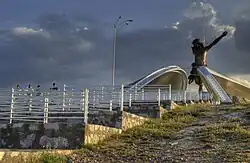
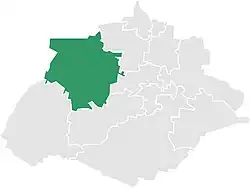
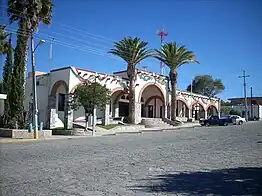
San José de Gracia, or simply San José, is a municipality and town in the Mexican state of Aguascalientes. The town of San José de Gracia serves as the municipal seat for the surrounding municipality of San José de Gracia.
San José de Gracia | |
|---|---|
 | |
 Municipality location in Aguascalientes | |
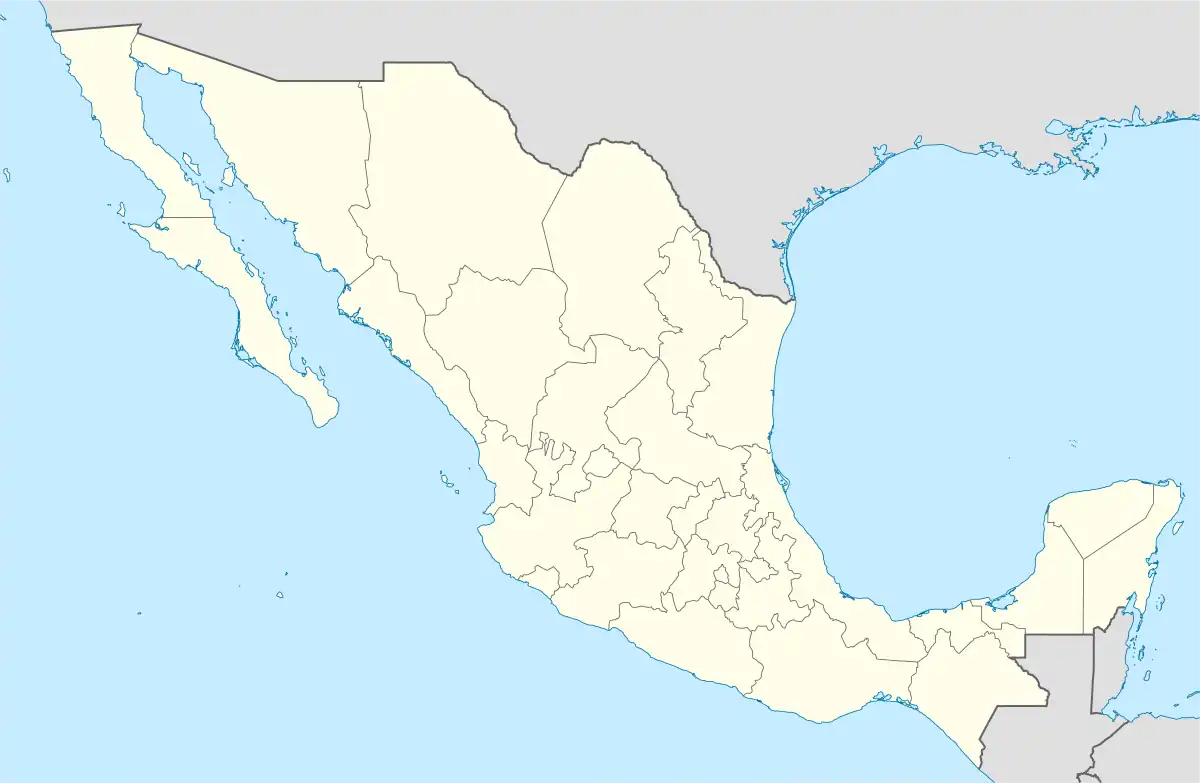
 San José de Gracia Location in Mexico | |
| Coordinates: 22°09′N 102°25′W | |
| Country | Mexico |
| State | Aguascalientes |
| Municipality | San José de Gracia |
| Area | |
| • Land | 868.933 km2 (335.497 sq mi) |
| Population (2015)[2] | |
| • Total | 8,896 |
| • Density | 10.2/km2 (26/sq mi) |
History

The origins of San José de Gracia go back to the time of the congregation of indigenous Chichimecas who worked in the hacienda de garabato but when dying their last benefit was that they could settle in the foothills of the Sierra Fría, in a place that over time would be called "de Martha" ", this between the years 1673 and 1675. In 1928, due to the construction of the President Calles Dam, the municipal seat was suppressed, being decreed again in 1934 and confirmed as a municipality in 1953.
The small community was made up of sixteen families and subsisted on hunting, fishing, cutting and carving wood. It was headed by the Indian Juan Domínguez. This was made up of men, women and children and their dress was Nahua with a blanket, long hair, they used as a defense weapon the bow and arrow, their homes were made of stone, mud and grass. They were conforming their small society that commonly was called "Jacales".
Among the most outstanding historical vestiges of regional history, are the memories of the appointment to the old town as "San Joseph" in honor of the son of King Ferdinand VII (Joseph Villaseñor) in 1862.
In the epoch of Independence the Priest Miguel Hidalgo y Costilla arrived in this land, leaving an indelible mark on this town inside the Freedom Route after having been defeated in the Puente de Calderón, on January 19, 1811. He took refuge in the arms of this cozy social niche for five days and then leaves for the Pabellón de Hidalgo Hacienda where he is removed from command as leader of the Insurgent movement.
In the life of the town an event happened that changed the way of thinking of the inhabitants and that undoubtedly increased the religious devotion in Christianity: the arrival of the Original Lord, the image most loved and adored by those faithful dwellers. Legend has it that this Christ arrived inside a wooden box on a mule. This animal after wandering a few days in the streets went to the main door of the temple, no muleteer was its owner, some men to see the animal outside the church put the box to the place. When they uncovered it, they were surprised to see what it contained: a beautiful image of Christ the Redeemer Crucified. They tolled the bells to gather the people, they took him on a pilgrimage, they cheered him with songs, prayers and prayers, they asked for their crops and the blessing for their families.
In 1926, church and government lived an open confrontation: the Cristero War. Strong attacks of generals against religious happened in the mountains and in the streets of San José, all this for the struggle of a fair distribution of their lands.
.jpg.webp)
Within this same year, the government of President Plutarco Elías Calles decided to build the first hydraulic work in the country, using communal and ejidal land. The construction lasted approximately one year, starting on May 30, 1927, and ending on June 30, 1928. This large concrete curtain would make up the First Water Storage Irrigation District for the agricultural irrigation of the Aguascalientes Valley shoal.
But the channel of the Presa would be so great that the small town where the tower of the temple was distinguished in the distance, would be devastated by the levels, reaching an absolute disappearance.
By 1930 the Old Town of San José had been abandoned. However, thanks to the decision of people like Antonio Ventura Medina, Rafael González Guerra and Juan García, among others, to found a new town and with the help of ejidatarios who fought over the land to find a safe place to live, the town He resurfaced as San José de Gracia.
Geography
Climate
| Climate data for San José de Gracia (Presa Calles) 1951–2010 | |||||||||||||
|---|---|---|---|---|---|---|---|---|---|---|---|---|---|
| Month | Jan | Feb | Mar | Apr | May | Jun | Jul | Aug | Sep | Oct | Nov | Dec | Year |
| Record high °C (°F) | 29.8 (85.6) |
32.0 (89.6) |
34.6 (94.3) |
36.0 (96.8) |
37.0 (98.6) |
43.0 (109.4) |
39.0 (102.2) |
33.0 (91.4) |
32.0 (89.6) |
33.0 (91.4) |
30.0 (86.0) |
29.2 (84.6) |
43.0 (109.4) |
| Average high °C (°F) | 21.5 (70.7) |
23.2 (73.8) |
25.8 (78.4) |
28.4 (83.1) |
29.9 (85.8) |
28.4 (83.1) |
26.1 (79.0) |
26.0 (78.8) |
25.1 (77.2) |
24.9 (76.8) |
24.0 (75.2) |
21.9 (71.4) |
25.4 (77.7) |
| Daily mean °C (°F) | 12.6 (54.7) |
14.0 (57.2) |
16.6 (61.9) |
19.3 (66.7) |
21.2 (70.2) |
21.1 (70.0) |
19.7 (67.5) |
19.6 (67.3) |
18.8 (65.8) |
17.3 (63.1) |
15.0 (59.0) |
13.2 (55.8) |
17.4 (63.3) |
| Average low °C (°F) | 3.6 (38.5) |
4.8 (40.6) |
7.4 (45.3) |
10.2 (50.4) |
12.5 (54.5) |
13.9 (57.0) |
13.4 (56.1) |
13.1 (55.6) |
12.5 (54.5) |
9.7 (49.5) |
6.1 (43.0) |
4.5 (40.1) |
9.3 (48.7) |
| Record low °C (°F) | −12.0 (10.4) |
−8.6 (16.5) |
−5.0 (23.0) |
−3.0 (26.6) |
5.0 (41.0) |
4.0 (39.2) |
7.0 (44.6) |
1.4 (34.5) |
1.5 (34.7) |
−1.5 (29.3) |
−8.0 (17.6) |
−9.8 (14.4) |
−12.0 (10.4) |
| Average precipitation mm (inches) | 14.6 (0.57) |
7.9 (0.31) |
4.4 (0.17) |
6.7 (0.26) |
20.8 (0.82) |
80.1 (3.15) |
108.5 (4.27) |
99.0 (3.90) |
75.4 (2.97) |
34.2 (1.35) |
7.6 (0.30) |
9.8 (0.39) |
469.0 (18.46) |
| Average precipitation days (≥ 0.1 mm) | 2.0 | 1.3 | 0.8 | 1.2 | 3.1 | 8.4 | 11.5 | 11.3 | 9.1 | 4.5 | 1.2 | 1.8 | 56.2 |
| Source: Servicio Meteorologico Nacional[3][4] | |||||||||||||
Demographics
| Year | Pop. | ±% |
|---|---|---|
| 2010 | 8,443 | — |
| 2015 | 8,896 | +5.4% |
| 2020 | 9,552 | +7.4% |
| [5][6][7][8] | ||
As of the 2015 Mexican Intercensal Survey, San José de Gracia municipality has a population of 8,896.[2]
As of 2010, the town of San José de Gracia had a population of 4,927.[9] Other than the town of San José de Gracia, the municipality had 130 localities, the largest of which (with 2010 populations in parentheses) were: San Antonio de los Ríos (1,043) and Paredes (1,017), classified as rural.[9] As of 2010, the town had a total population of 4,927.[9]
References
- "Unidad de Microrregiones Cedulas de Informacion Municipal (SCIM)" (in Spanish). Secretara de Desarrollo Social. Archived from the original on December 31, 2017. Retrieved November 18, 2017.
- "Tabulados de la Encuesta Intercensal 2015" (xls) (in Spanish). INEGI. Archived from the original on December 31, 2017. Retrieved July 15, 2017.
- "Estado de Aguascalientes-Estacion: Presa Calles". Normales Climatologicas 1951–2010 (in Spanish). Servicio Meteorologico Nacional. Archived from the original on May 18, 2015. Retrieved May 8, 2015.
- "Extreme Temperatures and Precipitation for Presa Calles 1933–2010" (in Spanish). Servicio Meteorológico Nacional. Archived from the original on May 18, 2015. Retrieved May 8, 2015.
- "Localidades y su población por municipio según tamaño de localidad" (PDF) (in Spanish). INEGI. Archived from the original (PDF) on August 31, 2018. Retrieved July 15, 2017.
- "Número de habitantes". INEGI (National Institute of Statistics and Geography). Archived from the original on July 2, 2017. Retrieved July 15, 2017.
- "Tabulados de la Encuesta Intercensal 2015" (xls) (in Spanish). INEGI. Archived from the original on December 31, 2017. Retrieved July 15, 2017.
- "INEGI. Censo de Población y Vivienda 2020. Tabulados del Cuestionario Básico – Aguascalientes" [INEGI. 2020 Population and Housing Census. Basic Questionnaire Tabulations – Aguascalientes] (Excel) (in Spanish). INEGI. 2020. pp. 1–4. Archived from the original on January 28, 2021. Retrieved January 27, 2021.
- "San José de Gracia". Catálogo de Localidades. Secretaría de Desarrollo Social (SEDESOL). Retrieved April 23, 2014.
