Scagnostics
Scagnostics (scatterplot diagnostics) refers to a series of measures that characterize certain properties of a point cloud in a scatter plot. The term and idea was coined by John Tukey and Paul Tukey, though they didn't publish it; later it was elaborated by Wilkinson, Anand, and Grossman. The following nine dimensions are considered:[1][2]
- For the outliers in the data:
- outlying
- For the density of data points:
- skewed
- clumpy
- sparse
- striated
- For the shape of the point cloud:
- convex
- skinny
- stringy
- For trends in the data:
- monotony
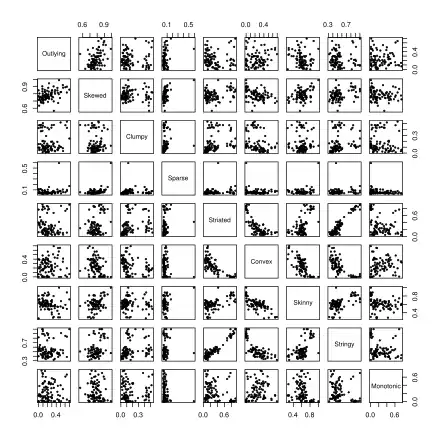
Scatterplot matrix of the scagnostics measures for the 91 scatterplots of the variables of the Boston Housing data set
References
- Wilkinson, Leland (23 April 2008). "Scagnostics". Retrieved 25 March 2022.
{{cite journal}}: Cite journal requires|journal=(help) - Wilkinson, Leland; Anand, Anushka; Grossman, Robert (2005). "Graph-theoretic scagnostics". In Proc. 2005 IEEE Symp. On Information Visualization (INFOVIS: 157–164. CiteSeerX 10.1.1.329.1315.
This article is issued from Wikipedia. The text is licensed under Creative Commons - Attribution - Sharealike. Additional terms may apply for the media files.