Shenzhou City
Shenzhou (Chinese: 深州; pinyin: Shēnzhōu) is a county-level city under the administration of the prefecture-level city of Hengshui, Hebei province, China.
Shenzhou
深州市 | |
|---|---|
.jpg.webp) Platform of Shenzhou railway station | |
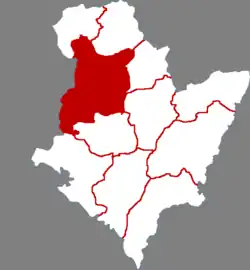
 Shenzhou in Hengshui | |
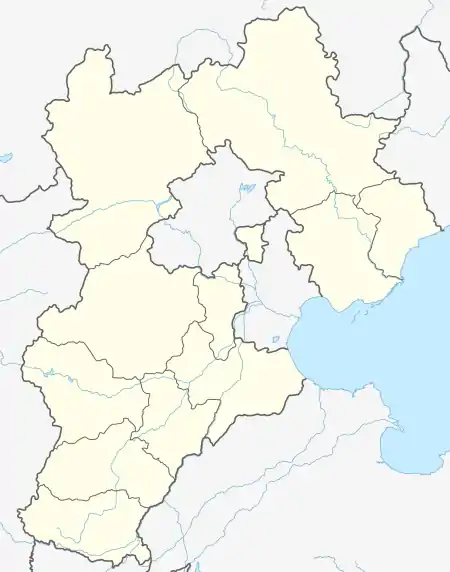
 Shenzhou Location in Hebei | |
| Coordinates: 38°00′07″N 115°33′36″E | |
| Country | People's Republic of China |
| Province | Hebei |
| Prefecture | Hengshui |
| Area | |
| • County-level city | 1,252.0 km2 (483.4 sq mi) |
| • Urban | 83.19 km2 (32.12 sq mi) |
| Population (2017) | |
| • County-level city | 613,000 |
| • Density | 490/km2 (1,300/sq mi) |
| • Urban | 191,000 |
| Time zone | UTC+8 (China Standard) |
| Postal code | 053300 |
Administrative divisions
[2] Towns:
- Tangfeng (唐奉镇), Shenzhou Town (深州镇), Chenshi (辰时镇), Yuke (榆科镇), Weiqiao (魏桥镇), Dadi (大堤镇), Qianmotou (前磨头镇), Wangjiajing (王家井镇), Hujiachi (护驾迟镇)
Townships:
- Bingcao Township (兵曹乡), Mucun Township (穆村乡), Dong'anzhuang Township (东安庄乡), Beixicun Township (北溪村乡), Dafengying Township (大冯营乡), Qiaotun Township (乔屯乡), Taiguzhuang Township (太古庄乡), Datun Township (大屯乡)
Climate
| Climate data for Shenzhou (1991–2020 normals, extremes 1981–2010) | |||||||||||||
|---|---|---|---|---|---|---|---|---|---|---|---|---|---|
| Month | Jan | Feb | Mar | Apr | May | Jun | Jul | Aug | Sep | Oct | Nov | Dec | Year |
| Record high °C (°F) | 16.3 (61.3) |
22.5 (72.5) |
31.4 (88.5) |
33.1 (91.6) |
40.6 (105.1) |
39.9 (103.8) |
42.7 (108.9) |
37.6 (99.7) |
35.4 (95.7) |
31.6 (88.9) |
25.9 (78.6) |
18.3 (64.9) |
42.7 (108.9) |
| Average high °C (°F) | 3.2 (37.8) |
7.5 (45.5) |
14.6 (58.3) |
21.8 (71.2) |
27.5 (81.5) |
32.1 (89.8) |
32.4 (90.3) |
30.7 (87.3) |
27.0 (80.6) |
20.7 (69.3) |
11.5 (52.7) |
4.6 (40.3) |
19.5 (67.1) |
| Daily mean °C (°F) | −2.2 (28.0) |
1.5 (34.7) |
8.2 (46.8) |
15.3 (59.5) |
21.3 (70.3) |
26.1 (79.0) |
27.4 (81.3) |
25.8 (78.4) |
21.3 (70.3) |
14.5 (58.1) |
6.0 (42.8) |
−0.4 (31.3) |
13.7 (56.7) |
| Average low °C (°F) | −6.3 (20.7) |
−3.0 (26.6) |
3.0 (37.4) |
9.7 (49.5) |
15.6 (60.1) |
20.6 (69.1) |
23.0 (73.4) |
21.7 (71.1) |
16.8 (62.2) |
9.7 (49.5) |
1.9 (35.4) |
−4.1 (24.6) |
9.1 (48.3) |
| Record low °C (°F) | −18.3 (−0.9) |
−16.3 (2.7) |
−11.2 (11.8) |
−1.6 (29.1) |
5.9 (42.6) |
10.7 (51.3) |
16.7 (62.1) |
13.5 (56.3) |
5.3 (41.5) |
−2.3 (27.9) |
−15.8 (3.6) |
−21.9 (−7.4) |
−21.9 (−7.4) |
| Average precipitation mm (inches) | 1.6 (0.06) |
5.3 (0.21) |
8.1 (0.32) |
26.4 (1.04) |
37.0 (1.46) |
58.7 (2.31) |
126.9 (5.00) |
109.0 (4.29) |
39.1 (1.54) |
27.5 (1.08) |
13.2 (0.52) |
2.9 (0.11) |
455.7 (17.94) |
| Average precipitation days (≥ 0.1 mm) | 1.5 | 2.2 | 2.3 | 4.9 | 6.1 | 8.0 | 10.8 | 9.8 | 6.1 | 5.0 | 3.1 | 1.7 | 61.5 |
| Average snowy days | 2.8 | 2.8 | 0.8 | 0.2 | 0 | 0 | 0 | 0 | 0 | 0 | 1.3 | 2.3 | 10.2 |
| Average relative humidity (%) | 57 | 52 | 49 | 54 | 57 | 59 | 75 | 79 | 70 | 64 | 64 | 60 | 62 |
| Mean monthly sunshine hours | 164.5 | 170.4 | 223.1 | 249.7 | 274.3 | 250.6 | 212.0 | 216.6 | 211.8 | 200.4 | 166.3 | 159.5 | 2,499.2 |
| Percent possible sunshine | 54 | 55 | 60 | 63 | 62 | 57 | 48 | 52 | 57 | 59 | 55 | 54 | 56 |
| Source: China Meteorological Administration[3][4] | |||||||||||||
References
- Ministry of Housing and Urban-Rural Development, ed. (2019). China Urban Construction Statistical Yearbook 2017. Beijing: China Statistics Press. p. 46. Retrieved 11 January 2020.
- 中国气象数据网 – WeatherBk Data (in Simplified Chinese). China Meteorological Administration. Retrieved 26 August 2023.
- 中国气象数据网 (in Simplified Chinese). China Meteorological Administration. Retrieved 26 August 2023.
External links
This article is issued from Wikipedia. The text is licensed under Creative Commons - Attribution - Sharealike. Additional terms may apply for the media files.