Skanderborg (nomination district)
Skanderborg nominating district is one of the 92 nominating districts that exists for Danish elections following the 2007 municipal reform.[3][4][5] It consists of Odder, Samsø and Skanderborg municipality.[6] It was created in 1849[7] as a constituency, and has been a nomination district since 1920, though its boundaries have been changed since then.
| Skanderborg | |
|---|---|
| Skanderborg | |
| Nomination district constituency for the Folketing | |
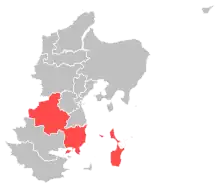 Location of Skanderborg within East Jutland | |
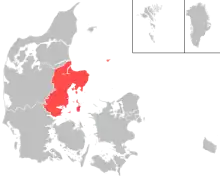 Location of East Jutland within Denmark | |
| Municipalities | Odder Samsø Skanderborg |
| Constituency | East Jutland |
| Electorate | 66,242 (2022)[1] |
| Current constituency | |
| Created | 1849 (as constituency)[2] 1920 (as nomination district) |
In general elections, the district has tended to vote close to the national result, when looking at the voter split between the two blocs.[8]
General elections results
General elections in the 2020s
| Parties | Vote | |||||
|---|---|---|---|---|---|---|
| Votes | % | + / - | ||||
| Social Democrats | 15,925 | 27.40 | +1.25 | |||
| Venstre | 8,138 | 14.00 | -11.23 | |||
| Green Left | 5,548 | 9.55 | +1.35 | |||
| Moderates | 5,450 | 9.38 | New | |||
| Liberal Alliance | 5,225 | 8.99 | +6.69 | |||
| Denmark Democrats | 4,218 | 7.26 | New | |||
| Conservatives | 3,156 | 5.43 | -1.42 | |||
| Red–Green Alliance | 2,522 | 4.34 | -1.41 | |||
| Social Liberals | 2,343 | 4.03 | -4.62 | |||
| The Alternative | 2,098 | 3.61 | +0.39 | |||
| New Right | 2,072 | 3.56 | +1.63 | |||
| Danish People's Party | 1,000 | 1.72 | -6.16 | |||
| Christian Democrats | 226 | 0.39 | -1.41 | |||
| Independent Greens | 139 | 0.24 | New | |||
| Jesper Antonsen | 53 | 0.09 | New | |||
| Chresten H. Ibsen | 8 | 0.01 | -0.09 | |||
| Total | 58,121 | |||||
| Source[9] | ||||||
General elections in the 2010s
| Parties | Vote | |||||
|---|---|---|---|---|---|---|
| Votes | % | + / - | ||||
| Social Democrats | 14,720 | 26.15 | -1.91 | |||
| Venstre | 14,200 | 25.23 | +3.78 | |||
| Social Liberals | 4,867 | 8.65 | +4.17 | |||
| Green Left | 4,613 | 8.20 | +4.14 | |||
| Danish People's Party | 4,436 | 7.88 | -10.66 | |||
| Conservatives | 3,854 | 6.85 | +3.79 | |||
| Red–Green Alliance | 3,234 | 5.75 | -0.01 | |||
| The Alternative | 1,812 | 3.22 | -2.82 | |||
| Liberal Alliance | 1,292 | 2.30 | -5.52 | |||
| New Right | 1,084 | 1.93 | New | |||
| Christian Democrats | 1,013 | 1.80 | +1.20 | |||
| Stram Kurs | 688 | 1.22 | New | |||
| Klaus Riskær Pedersen Party | 415 | 0.74 | New | |||
| Chresten H. Ibsen | 56 | 0.10 | New | |||
| Hans Schultz | 5 | 0.01 | New | |||
| Total | 56,289 | |||||
| Source[10] | ||||||
| Parties | Vote | |||||
|---|---|---|---|---|---|---|
| Votes | % | + / - | ||||
| Social Democrats | 15,251 | 28.06 | +2.21 | |||
| Venstre | 11,658 | 21.45 | -9.45 | |||
| Danish People's Party | 10,077 | 18.54 | +8.51 | |||
| Liberal Alliance | 4,249 | 7.82 | +3.16 | |||
| The Alternative | 3,284 | 6.04 | New | |||
| Red–Green Alliance | 3,133 | 5.76 | +0.53 | |||
| Social Liberals | 2,437 | 4.48 | -5.33 | |||
| Green Left | 2,207 | 4.06 | -5.00 | |||
| Conservatives | 1,663 | 3.06 | -1.01 | |||
| Christian Democrats | 328 | 0.60 | +0.21 | |||
| Yahya Hassan | 49 | 0.09 | New | |||
| Peter Ymer Nielsen | 15 | 0.03 | New | |||
| Poul Gundersen | 5 | 0.01 | New | |||
| Total | 54,356 | |||||
| Source[11] | ||||||
| Parties | Vote | |||||
|---|---|---|---|---|---|---|
| Votes | % | + / - | ||||
| Venstre | 16,703 | 30.90 | +0.36 | |||
| Social Democrats | 13,975 | 25.85 | -0.61 | |||
| Danish People's Party | 5,421 | 10.03 | -1.35 | |||
| Social Liberals | 5,301 | 9.81 | +4.73 | |||
| Green Left | 4,896 | 9.06 | -2.96 | |||
| Red–Green Alliance | 2,825 | 5.23 | +3.65 | |||
| Liberal Alliance | 2,519 | 4.66 | +1.51 | |||
| Conservatives | 2,200 | 4.07 | -5.17 | |||
| Christian Democrats | 209 | 0.39 | -0.14 | |||
| Ibrahim Gøkhan | 4 | 0.01 | New | |||
| Janus Kramer Møller | 3 | 0.01 | New | |||
| Total | 54,056 | |||||
| Source[12] | ||||||
General elections in the 2000s
| Parties | Vote | |||||
|---|---|---|---|---|---|---|
| Votes | % | + / - | ||||
| Venstre | 15,964 | 30.54 | -2.56 | |||
| Social Democrats | 13,828 | 26.46 | -1.41 | |||
| Green Left | 6,281 | 12.02 | +6.97 | |||
| Danish People's Party | 5,948 | 11.38 | +0.78 | |||
| Conservatives | 4,828 | 9.24 | -0.80 | |||
| Social Liberals | 2,657 | 5.08 | -2.76 | |||
| New Alliance | 1,646 | 3.15 | New | |||
| Red–Green Alliance | 826 | 1.58 | -1.37 | |||
| Christian Democrats | 275 | 0.53 | -0.76 | |||
| Jes Krogh | 11 | 0.02 | New | |||
| Total | 52,264 | |||||
| Source[13] | ||||||
| Parties | Vote | |||||
|---|---|---|---|---|---|---|
| Votes | % | + / - | ||||
| Venstre | 11,738 | 33.10 | -2.85 | |||
| Social Democrats | 9,884 | 27.87 | -2.22 | |||
| Danish People's Party | 3,760 | 10.60 | +0.98 | |||
| Conservatives | 3,559 | 10.04 | +1.85 | |||
| Social Liberals | 2,780 | 7.84 | +3.56 | |||
| Green Left | 1,792 | 5.05 | -0.61 | |||
| Red–Green Alliance | 1,047 | 2.95 | +0.95 | |||
| Christian Democrats | 458 | 1.29 | -0.65 | |||
| Centre Democrats | 345 | 0.97 | -0.71 | |||
| Minority Party | 93 | 0.26 | New | |||
| Janus Kramer Møller | 9 | 0.03 | New | |||
| Total | 35,465 | |||||
| Source[14] | ||||||
| Parties | Vote | |||||
|---|---|---|---|---|---|---|
| Votes | % | + / - | ||||
| Venstre | 12,683 | 35.95 | +6.46 | |||
| Social Democrats | 10,618 | 30.09 | -6.99 | |||
| Danish People's Party | 3,396 | 9.62 | +3.86 | |||
| Conservatives | 2,890 | 8.19 | +1.29 | |||
| Green Left | 1,998 | 5.66 | -0.86 | |||
| Social Liberals | 1,511 | 4.28 | +0.72 | |||
| Red–Green Alliance | 706 | 2.00 | -0.44 | |||
| Christian People's Party | 683 | 1.94 | +0.23 | |||
| Centre Democrats | 593 | 1.68 | -2.97 | |||
| Progress Party | 188 | 0.53 | -0.91 | |||
| Lars Bang | 18 | 0.05 | New | |||
| Total | 35,284 | |||||
| Source[15] | ||||||
General elections in the 1990s
| Parties | Vote | |||||
|---|---|---|---|---|---|---|
| Votes | % | + / - | ||||
| Social Democrats | 12,696 | 37.08 | +4.17 | |||
| Venstre | 10,097 | 29.49 | +2.73 | |||
| Conservatives | 2,361 | 6.90 | -6.01 | |||
| Green Left | 2,233 | 6.52 | +1.10 | |||
| Danish People's Party | 1,971 | 5.76 | New | |||
| Centre Democrats | 1,591 | 4.65 | +1.94 | |||
| Social Liberals | 1,220 | 3.56 | -0.79 | |||
| Red–Green Alliance | 836 | 2.44 | +0.07 | |||
| Christian People's Party | 585 | 1.71 | +0.55 | |||
| Progress Party | 493 | 1.44 | -3.48 | |||
| Democratic Renewal | 143 | 0.42 | New | |||
| John Juhler | 14 | 0.04 | New | |||
| Total | 34,240 | |||||
| Source[16] | ||||||
| Parties | Vote | |||||
|---|---|---|---|---|---|---|
| Votes | % | + / - | ||||
| Social Democrats | 10,881 | 32.91 | -2.21 | |||
| Venstre | 8,847 | 26.76 | +6.48 | |||
| Conservatives | 4,268 | 12.91 | -2.30 | |||
| Jacob Haugaard | 2,137 | 6.46 | +4.49 | |||
| Green Left | 1,792 | 5.42 | -1.97 | |||
| Progress Party | 1,625 | 4.92 | -1.72 | |||
| Social Liberals | 1,439 | 4.35 | +0.84 | |||
| Centre Democrats | 896 | 2.71 | -2.19 | |||
| Red–Green Alliance | 784 | 2.37 | +1.20 | |||
| Christian People's Party | 384 | 1.16 | -0.09 | |||
| Søren Boelskifte | 6 | 0.02 | New | |||
| Bjarne S. Landsfeldt | 3 | 0.01 | New | |||
| Total | 33,062 | |||||
| Source[17] | ||||||
| Parties | Vote | |||||
|---|---|---|---|---|---|---|
| Votes | % | + / - | ||||
| Social Democrats | 11,047 | 35.12 | +5.04 | |||
| Venstre | 6,380 | 20.28 | +3.50 | |||
| Conservatives | 4,784 | 15.21 | -4.06 | |||
| Green Left | 2,324 | 7.39 | -3.41 | |||
| Progress Party | 2,088 | 6.64 | -1.38 | |||
| Centre Democrats | 1,540 | 4.90 | +0.59 | |||
| Social Liberals | 1,104 | 3.51 | -2.06 | |||
| Jacob Haugaard | 619 | 1.97 | +1.22 | |||
| Christian People's Party | 394 | 1.25 | +0.14 | |||
| Red–Green Alliance | 367 | 1.17 | New | |||
| The Greens | 294 | 0.93 | -0.12 | |||
| Common Course | 287 | 0.91 | -0.30 | |||
| Justice Party of Denmark | 229 | 0.73 | New | |||
| Total | 31,457 | |||||
| Source[18] | ||||||
General elections in the 1980s
| Parties | Vote | |||||
|---|---|---|---|---|---|---|
| Votes | % | + / - | ||||
| Social Democrats | 9,582 | 30.08 | +0.50 | |||
| Conservatives | 6,137 | 19.27 | -1.13 | |||
| Venstre | 5,346 | 16.78 | +1.52 | |||
| Green Left | 3,439 | 10.80 | -1.35 | |||
| Progress Party | 2,556 | 8.02 | +3.96 | |||
| Social Liberals | 1,775 | 5.57 | -1.25 | |||
| Centre Democrats | 1,372 | 4.31 | -0.04 | |||
| Common Course | 385 | 1.21 | -0.47 | |||
| Christian People's Party | 353 | 1.11 | -0.35 | |||
| The Greens | 334 | 1.05 | -0.11 | |||
| Jacob Haugaard | 240 | 0.75 | +0.25 | |||
| Communist Party of Denmark | 213 | 0.67 | -0.11 | |||
| Left Socialists | 115 | 0.36 | -0.55 | |||
| Finn Mikkelsen | 4 | 0.01 | New | |||
| Bruno Nielsen-Boreas | 0 | 0.00 | New | |||
| Total | 31,851 | |||||
| Source[19] | ||||||
| Parties | Vote | |||||
|---|---|---|---|---|---|---|
| Votes | % | + / - | ||||
| Social Democrats | 9,471 | 29.58 | +0.70 | |||
| Conservatives | 6,533 | 20.40 | -3.56 | |||
| Venstre | 4,885 | 15.26 | -1.18 | |||
| Green Left | 3,890 | 12.15 | +1.63 | |||
| Social Liberals | 2,183 | 6.82 | +0.37 | |||
| Centre Democrats | 1,392 | 4.35 | -0.44 | |||
| Progress Party | 1,300 | 4.06 | +1.06 | |||
| Common Course | 537 | 1.68 | New | |||
| Christian People's Party | 468 | 1.46 | -0.04 | |||
| The Greens | 371 | 1.16 | New | |||
| Left Socialists | 291 | 0.91 | -0.92 | |||
| Communist Party of Denmark | 251 | 0.78 | +0.35 | |||
| Justice Party of Denmark | 223 | 0.70 | -1.26 | |||
| Jacob Haugaard | 159 | 0.50 | +0.40 | |||
| Humanist Party | 40 | 0.12 | New | |||
| Socialist Workers Party | 21 | 0.07 | -0.05 | |||
| Marxist–Leninists Party | 3 | 0.01 | -0.01 | |||
| Henning Brønd-Nielsen | 3 | 0.01 | New | |||
| Total | 32,021 | |||||
| Source[20] | ||||||
| Parties | Vote | |||||
|---|---|---|---|---|---|---|
| Votes | % | + / - | ||||
| Social Democrats | 9,040 | 28.88 | -2.30 | |||
| Conservatives | 7,502 | 23.96 | +10.76 | |||
| Venstre | 5,147 | 16.44 | +0.27 | |||
| Green Left | 3,293 | 10.52 | +0.44 | |||
| Social Liberals | 2,018 | 6.45 | +0.60 | |||
| Centre Democrats | 1,499 | 4.79 | -4.38 | |||
| Progress Party | 938 | 3.00 | -5.74 | |||
| Justice Party of Denmark | 615 | 1.96 | +0.06 | |||
| Left Socialists | 573 | 1.83 | +0.31 | |||
| Christian People's Party | 469 | 1.50 | +0.30 | |||
| Communist Party of Denmark | 134 | 0.43 | -0.29 | |||
| Socialist Workers Party | 39 | 0.12 | +0.06 | |||
| Jacob Haugaard | 30 | 0.10 | -0.04 | |||
| Marxist–Leninists Party | 7 | 0.02 | New | |||
| Total | 31,304 | |||||
| Source[21] | ||||||
| Parties | Vote | |||||
|---|---|---|---|---|---|---|
| Votes | % | + / - | ||||
| Social Democrats | 9,178 | 31.18 | -5.88 | |||
| Venstre | 4,760 | 16.17 | -1.04 | |||
| Conservatives | 3,887 | 13.20 | +0.79 | |||
| Green Left | 2,966 | 10.08 | +5.11 | |||
| Centre Democrats | 2,700 | 9.17 | +5.96 | |||
| Progress Party | 2,574 | 8.74 | -0.98 | |||
| Social Liberals | 1,721 | 5.85 | -0.46 | |||
| Justice Party of Denmark | 558 | 1.90 | -1.22 | |||
| Left Socialists | 448 | 1.52 | -1.19 | |||
| Christian People's Party | 353 | 1.20 | -0.28 | |||
| Communist Party of Denmark | 211 | 0.72 | -0.64 | |||
| Jacob Haugaard | 41 | 0.14 | 0.00 | |||
| Communist Workers Party | 21 | 0.07 | -0.22 | |||
| Socialist Workers Party | 17 | 0.06 | New | |||
| Henrik Christensen | 1 | 0.00 | New | |||
| Lars Michaelsen | 1 | 0.00 | New | |||
| Total | 29,437 | |||||
| Source[22] | ||||||
General elections in the 1970s
| Parties | Vote | |||||
|---|---|---|---|---|---|---|
| Votes | % | + / - | ||||
| Social Democrats | 10,862 | 37.06 | +2.12 | |||
| Venstre | 5,043 | 17.21 | +0.63 | |||
| Conservatives | 3,636 | 12.41 | +4.56 | |||
| Progress Party | 2,849 | 9.72 | -4.68 | |||
| Social Liberals | 1,849 | 6.31 | +1.42 | |||
| Green Left | 1,457 | 4.97 | +1.80 | |||
| Centre Democrats | 942 | 3.21 | -2.80 | |||
| Justice Party of Denmark | 915 | 3.12 | -1.14 | |||
| Left Socialists | 794 | 2.71 | +0.61 | |||
| Christian People's Party | 435 | 1.48 | -1.20 | |||
| Communist Party of Denmark | 398 | 1.36 | -1.10 | |||
| Communist Workers Party | 84 | 0.29 | New | |||
| Jacob Haugaard | 42 | 0.14 | New | |||
| Total | 29,306 | |||||
| Source[23] | ||||||
| Parties | Vote | |||||
|---|---|---|---|---|---|---|
| Votes | % | + / - | ||||
| Social Democrats | 9,710 | 34.94 | +6.03 | |||
| Venstre | 4,608 | 16.58 | -11.23 | |||
| Progress Party | 4,001 | 14.40 | +1.46 | |||
| Conservatives | 2,183 | 7.85 | +3.22 | |||
| Centre Democrats | 1,670 | 6.01 | +4.07 | |||
| Social Liberals | 1,359 | 4.89 | -4.16 | |||
| Justice Party of Denmark | 1,185 | 4.26 | +1.50 | |||
| Green Left | 881 | 3.17 | -0.21 | |||
| Christian People's Party | 746 | 2.68 | -2.07 | |||
| Communist Party of Denmark | 685 | 2.46 | +0.22 | |||
| Left Socialists | 585 | 2.10 | +0.54 | |||
| Pensioners' Party | 169 | 0.61 | New | |||
| Tommy Nielsen | 10 | 0.04 | New | |||
| Total | 27,792 | |||||
| Source[24] | ||||||
| Parties | Vote | |||||
|---|---|---|---|---|---|---|
| Votes | % | + / - | ||||
| Social Democrats | 7,693 | 28.91 | +4.23 | |||
| Venstre | 7,400 | 27.81 | +11.22 | |||
| Progress Party | 3,444 | 12.94 | -3.56 | |||
| Social Liberals | 2,409 | 9.05 | -5.17 | |||
| Christian People's Party | 1,265 | 4.75 | +2.07 | |||
| Conservatives | 1,233 | 4.63 | -3.56 | |||
| Green Left | 899 | 3.38 | -0.20 | |||
| Justice Party of Denmark | 734 | 2.76 | -1.50 | |||
| Communist Party of Denmark | 596 | 2.24 | +0.50 | |||
| Centre Democrats | 517 | 1.94 | -4.43 | |||
| Left Socialists | 416 | 1.56 | +0.38 | |||
| Elmer Mariager | 6 | 0.02 | New | |||
| Total | 26,612 | |||||
| Source[25] | ||||||
| Parties | Vote | |||||
|---|---|---|---|---|---|---|
| Votes | % | + / - | ||||
| Social Democrats | 6,419 | 24.68 | -11.22 | |||
| Venstre | 4,314 | 16.59 | -5.17 | |||
| Progress Party | 4,291 | 16.50 | New | |||
| Social Liberals | 3,698 | 14.22 | -3.73 | |||
| Conservatives | 2,130 | 8.19 | -5.46 | |||
| Centre Democrats | 1,657 | 6.37 | New | |||
| Justice Party of Denmark | 1,107 | 4.26 | +1.11 | |||
| Green Left | 930 | 3.58 | -1.68 | |||
| Christian People's Party | 696 | 2.68 | +1.82 | |||
| Communist Party of Denmark | 452 | 1.74 | +1.08 | |||
| Left Socialists | 308 | 1.18 | +0.36 | |||
| John Bove | 7 | 0.03 | New | |||
| Total | 26,009 | |||||
| Source[26] | ||||||
| Parties | Vote | |||||
|---|---|---|---|---|---|---|
| Votes | % | + / - | ||||
| Social Democrats | 8,621 | 35.90 | +5.05 | |||
| Venstre | 5,225 | 21.76 | -6.44 | |||
| Social Liberals | 4,310 | 17.95 | +1.85 | |||
| Conservatives | 3,277 | 13.65 | -2.74 | |||
| Green Left | 1,262 | 5.26 | +1.75 | |||
| Justice Party of Denmark | 757 | 3.15 | +1.77 | |||
| Christian People's Party | 207 | 0.86 | New | |||
| Left Socialists | 197 | 0.82 | -0.08 | |||
| Communist Party of Denmark | 159 | 0.66 | +0.36 | |||
| Total | 24,015 | |||||
| Source[27] | ||||||
General elections in the 1960s
| Parties | Vote | |||||
|---|---|---|---|---|---|---|
| Votes | % | + / - | ||||
| Social Democrats | 5,830 | 30.85 | -4.59 | |||
| Venstre | 5,330 | 28.20 | -0.93 | |||
| Conservatives | 3,098 | 16.39 | +1.11 | |||
| Social Liberals | 3,042 | 16.10 | +7.87 | |||
| Green Left | 663 | 3.51 | -1.77 | |||
| Justice Party of Denmark | 260 | 1.38 | +0.10 | |||
| Independent Party | 226 | 1.20 | -1.88 | |||
| Liberal Centre | 222 | 1.17 | -0.85 | |||
| Left Socialists | 171 | 0.90 | New | |||
| Communist Party of Denmark | 57 | 0.30 | +0.03 | |||
| Total | 18,899 | |||||
| Source[28] | ||||||
| Parties | Vote | |||||
|---|---|---|---|---|---|---|
| Votes | % | + / - | ||||
| Social Democrats | 6,362 | 35.44 | -2.01 | |||
| Venstre | 5,229 | 29.13 | -1.52 | |||
| Conservatives | 2,743 | 15.28 | +0.23 | |||
| Social Liberals | 1,477 | 8.23 | +2.36 | |||
| Green Left | 948 | 5.28 | +2.61 | |||
| Independent Party | 553 | 3.08 | -1.41 | |||
| Liberal Centre | 363 | 2.02 | New | |||
| Justice Party of Denmark | 229 | 1.28 | -1.37 | |||
| Communist Party of Denmark | 49 | 0.27 | -0.06 | |||
| Total | 17,953 | |||||
| Source[29] | ||||||
| Parties | Vote | |||||
|---|---|---|---|---|---|---|
| Votes | % | + / - | ||||
| Social Democrats | 6,135 | 37.45 | +0.86 | |||
| Venstre | 5,020 | 30.65 | -2.93 | |||
| Conservatives | 2,466 | 15.05 | +4.80 | |||
| Social Liberals | 962 | 5.87 | -0.76 | |||
| Independent Party | 735 | 4.49 | -1.62 | |||
| Green Left | 437 | 2.67 | +0.08 | |||
| Justice Party of Denmark | 434 | 2.65 | -1.20 | |||
| Peace Politics People's Party | 84 | 0.51 | New | |||
| Communist Party of Denmark | 54 | 0.33 | -0.08 | |||
| Danish Unity | 54 | 0.33 | New | |||
| Total | 16,381 | |||||
| Source[30] | ||||||
| Parties | Vote | |||||
|---|---|---|---|---|---|---|
| Votes | % | + / - | ||||
| Social Democrats | 5,422 | 36.59 | +3.98 | |||
| Venstre | 4,977 | 33.58 | -4.78 | |||
| Conservatives | 1,519 | 10.25 | +1.87 | |||
| Social Liberals | 982 | 6.63 | -1.02 | |||
| Independent Party | 905 | 6.11 | +0.68 | |||
| Justice Party of Denmark | 570 | 3.85 | -2.79 | |||
| Green Left | 384 | 2.59 | New | |||
| Communist Party of Denmark | 61 | 0.41 | -0.52 | |||
| Total | 14,820 | |||||
| Source[31] | ||||||
General elections in the 1950s
| Parties | Vote | |||||
|---|---|---|---|---|---|---|
| Votes | % | + / - | ||||
| Venstre | 5,560 | 38.36 | +2.20 | |||
| Social Democrats | 4,727 | 32.61 | -3.11 | |||
| Conservatives | 1,214 | 8.38 | +0.73 | |||
| Social Liberals | 1,109 | 7.65 | +0.81 | |||
| Justice Party of Denmark | 963 | 6.64 | +0.48 | |||
| Independent Party | 787 | 5.43 | -0.77 | |||
| Communist Party of Denmark | 135 | 0.93 | -0.33 | |||
| Total | 14,495 | |||||
| Source[32] | ||||||
September 1953 Danish Folketing election
| Parties | Vote | |||||
|---|---|---|---|---|---|---|
| Votes | % | + / - | ||||
| Venstre | 5,058 | 36.16 | -1.59 | |||
| Social Democrats | 4,996 | 35.72 | +1.06 | |||
| Conservatives | 1,070 | 7.65 | -1.89 | |||
| Social Liberals | 957 | 6.84 | -0.57 | |||
| Independent Party | 867 | 6.20 | New | |||
| Justice Party of Denmark | 862 | 6.16 | -2.43 | |||
| Communist Party of Denmark | 176 | 1.26 | -0.24 | |||
| Total | 13,986 | |||||
| Source[33] | ||||||
April 1953 Danish Folketing election
| Parties | Vote | |||||
|---|---|---|---|---|---|---|
| Votes | % | + / - | ||||
| Venstre | 4,885 | 37.75 | -0.86 | |||
| Social Democrats | 4,486 | 34.66 | +0.51 | |||
| Conservatives | 1,235 | 9.54 | +0.98 | |||
| Justice Party of Denmark | 1,112 | 8.59 | -2.09 | |||
| Social Liberals | 959 | 7.41 | +0.78 | |||
| Communist Party of Denmark | 194 | 1.50 | +0.13 | |||
| Danish Unity | 71 | 0.55 | New | |||
| Total | 12,942 | |||||
| Source[34] | ||||||
1950 Danish Folketing election
| Parties | Vote | |||||
|---|---|---|---|---|---|---|
| Votes | % | + / - | ||||
| Venstre | 5,291 | 38.61 | -6.54 | |||
| Social Democrats | 4,680 | 34.15 | +0.77 | |||
| Justice Party of Denmark | 1,463 | 10.68 | +4.44 | |||
| Conservatives | 1,173 | 8.56 | +1.63 | |||
| Social Liberals | 908 | 6.63 | +1.19 | |||
| Communist Party of Denmark | 188 | 1.37 | -0.56 | |||
| Total | 13,703 | |||||
| Source[35] | ||||||
General elections in the 1940s
1947 Danish Folketing election
| Parties | Vote | |||||
|---|---|---|---|---|---|---|
| Votes | % | + / - | ||||
| Venstre | 6,277 | 45.15 | +2.37 | |||
| Social Democrats | 4,640 | 33.38 | +1.23 | |||
| Conservatives | 963 | 6.93 | -1.14 | |||
| Justice Party of Denmark | 868 | 6.24 | +2.86 | |||
| Social Liberals | 756 | 5.44 | -2.16 | |||
| Communist Party of Denmark | 269 | 1.93 | -2.02 | |||
| Danish Unity | 129 | 0.93 | -1.12 | |||
| Total | 13,902 | |||||
| Source[36] | ||||||
1945 Danish Folketing election
| Parties | Vote | |||||
|---|---|---|---|---|---|---|
| Votes | % | + / - | ||||
| Venstre | 5,867 | 42.78 | +8.95 | |||
| Social Democrats | 4,410 | 32.15 | -5.71 | |||
| Conservatives | 1,107 | 8.07 | -1.81 | |||
| Social Liberals | 1,042 | 7.60 | -1.21 | |||
| Communist Party of Denmark | 542 | 3.95 | New | |||
| Justice Party of Denmark | 463 | 3.38 | -0.05 | |||
| Danish Unity | 281 | 2.05 | +0.67 | |||
| Niels Lauritsen | 3 | 0.02 | New | |||
| Total | 13,715 | |||||
| Source[37] | ||||||
1943 Danish Folketing election
| Parties | Vote | |||||
|---|---|---|---|---|---|---|
| Votes | % | + / - | ||||
| Social Democrats | 5,114 | 37.86 | +2.13 | |||
| Venstre | 4,569 | 33.83 | +1.78 | |||
| Conservatives | 1,334 | 9.88 | +0.84 | |||
| Social Liberals | 1,190 | 8.81 | +0.65 | |||
| Farmers' Party | 489 | 3.62 | -3.12 | |||
| Justice Party of Denmark | 463 | 3.43 | -1.64 | |||
| Danish Unity | 186 | 1.38 | +0.85 | |||
| National Socialist Workers' Party of Denmark | 162 | 1.20 | -0.17 | |||
| Total | 13,507 | |||||
| Source[38] | ||||||
General elections in the 1930s
1939 Danish Folketing election
| Parties | Vote | |||||
|---|---|---|---|---|---|---|
| Votes | % | + / - | ||||
| Social Democrats | 4,219 | 35.73 | -1.85 | |||
| Venstre | 3,784 | 32.05 | -0.39 | |||
| Conservatives | 1,067 | 9.04 | +0.09 | |||
| Social Liberals | 963 | 8.16 | -0.60 | |||
| Farmers' Party | 796 | 6.74 | +1.19 | |||
| Justice Party of Denmark | 599 | 5.07 | -0.91 | |||
| National Socialist Workers' Party of Denmark | 162 | 1.37 | +0.99 | |||
| Communist Party of Denmark | 77 | 0.65 | +0.30 | |||
| National Cooperation | 77 | 0.65 | New | |||
| Danish Unity | 63 | 0.53 | New | |||
| Total | 11,807 | |||||
| Source[39] | ||||||
1935 Danish Folketing election
| Parties | Vote | |||||
|---|---|---|---|---|---|---|
| Votes | % | + / - | ||||
| Social Democrats | 4,493 | 37.58 | +2.38 | |||
| Venstre | 3,879 | 32.44 | -7.63 | |||
| Conservatives | 1,070 | 8.95 | -1.14 | |||
| Social Liberals | 1,048 | 8.76 | -1.47 | |||
| Justice Party of Denmark | 715 | 5.98 | +1.71 | |||
| Independent People's Party | 664 | 5.55 | New | |||
| National Socialist Workers' Party of Denmark | 46 | 0.38 | New | |||
| Communist Party of Denmark | 42 | 0.35 | +0.21 | |||
| Total | 11,957 | |||||
| Source[40] | ||||||
1932 Danish Folketing election
| Parties | Vote | |||||
|---|---|---|---|---|---|---|
| Votes | % | + / - | ||||
| Venstre | 4,716 | 40.07 | -3.77 | |||
| Social Democrats | 4,143 | 35.20 | +0.44 | |||
| Social Liberals | 1,204 | 10.23 | -2.29 | |||
| Conservatives | 1,188 | 10.09 | +3.58 | |||
| Justice Party of Denmark | 502 | 4.27 | +1.89 | |||
| Communist Party of Denmark | 16 | 0.14 | New | |||
| Total | 11,769 | |||||
| Source[41] | ||||||
General elections in the 1920s
1929 Danish Folketing election
| Parties | Vote | |||||
|---|---|---|---|---|---|---|
| Votes | % | + / - | ||||
| Venstre | 4,949 | 43.84 | -0.80 | |||
| Social Democrats | 3,924 | 34.76 | +3.26 | |||
| Social Liberals | 1,413 | 12.52 | -1.60 | |||
| Conservatives | 735 | 6.51 | -1.59 | |||
| Justice Party of Denmark | 269 | 2.38 | +0.80 | |||
| Total | 11,290 | |||||
| Source[42] | ||||||
1926 Danish Folketing election
| Parties | Vote | |||||
|---|---|---|---|---|---|---|
| Votes | % | + / - | ||||
| Venstre | 4,733 | 44.64 | -1.17 | |||
| Social Democrats | 3,340 | 31.50 | -0.12 | |||
| Social Liberals | 1,497 | 14.12 | -0.85 | |||
| Conservatives | 859 | 8.10 | +1.37 | |||
| Justice Party of Denmark | 168 | 1.58 | +0.71 | |||
| Communist Party of Denmark | 6 | 0.06 | New | |||
| Total | 10,603 | |||||
| Source[43] | ||||||
1924 Danish Folketing election
| Parties | Vote | |||||
|---|---|---|---|---|---|---|
| Votes | % | + / - | ||||
| Venstre | 4,634 | 45.81 | -6.92 | |||
| Social Democrats | 3,199 | 31.62 | +3.31 | |||
| Social Liberals | 1,514 | 14.97 | +4.74 | |||
| Conservatives | 681 | 6.73 | +2.03 | |||
| Justice Party of Denmark | 88 | 0.87 | New | |||
| Total | 10,116 | |||||
| Source[44] | ||||||
September 1920 Danish Folketing election
| Parties | Vote | |||||
|---|---|---|---|---|---|---|
| Votes | % | + / - | ||||
| Venstre | 5,224 | 52.73 | -2.56 | |||
| Social Democrats | 2,805 | 28.31 | +3.86 | |||
| Social Liberals | 1,013 | 10.23 | -0.44 | |||
| Conservatives | 466 | 4.70 | -0.38 | |||
| Industry Party | 391 | 3.95 | -0.52 | |||
| Danish Left Socialist Party | 8 | 0.08 | New | |||
| Total | 9,907 | |||||
| Source[45] | ||||||
July 1920 Danish Folketing election
| Parties | Vote | |||||
|---|---|---|---|---|---|---|
| Votes | % | + / - | ||||
| Venstre | 4,572 | 55.29 | +1.48 | |||
| Social Democrats | 2,022 | 24.45 | -0.71 | |||
| Social Liberals | 882 | 10.67 | -1.25 | |||
| Conservatives | 420 | 5.08 | +0.01 | |||
| Industry Party | 370 | 4.47 | +0.45 | |||
| Alfred M. R. Andersen | 3 | 0.04 | +0.02 | |||
| Total | 8,269 | |||||
| Source[46] | ||||||
April 1920 Danish Folketing election
| Parties | Vote | |||||
|---|---|---|---|---|---|---|
| Votes | % | |||||
| Venstre | 4,669 | 53.81 | ||||
| Social Democrats | 2,183 | 25.16 | ||||
| Social Liberals | 1,034 | 11.92 | ||||
| Conservatives | 440 | 5.07 | ||||
| Industry Party | 349 | 4.02 | ||||
| Alfred M. R. Andersen | 2 | 0.02 | ||||
| Total | 8,677 | |||||
| Source[47] | ||||||
European Parliament elections results
2019 European Parliament election in Denmark
| Parties | Vote | |||||
|---|---|---|---|---|---|---|
| Votes | % | + / - | ||||
| Venstre | 11,548 | 24.94 | +4.82 | |||
| Social Democrats | 10,552 | 22.79 | +3.72 | |||
| Green Left | 6,116 | 13.21 | +1.04 | |||
| Social Liberals | 4,736 | 10.23 | +3.34 | |||
| Danish People's Party | 4,369 | 9.44 | -14.39 | |||
| Conservatives | 2,789 | 6.02 | -1.76 | |||
| Red–Green Alliance | 2,169 | 4.69 | New | |||
| The Alternative | 1,579 | 3.41 | New | |||
| People's Movement against the EU | 1,395 | 3.01 | -3.99 | |||
| Liberal Alliance | 1,042 | 2.25 | -0.88 | |||
| Total | 46,295 | |||||
| Source[48] | ||||||
2014 European Parliament election in Denmark
| Parties | Vote | |||||
|---|---|---|---|---|---|---|
| Votes | % | + / - | ||||
| Danish People's Party | 8,818 | 23.83 | +9.91 | |||
| Venstre | 7,445 | 20.12 | -3.14 | |||
| Social Democrats | 7,058 | 19.07 | -3.49 | |||
| Green Left | 4,502 | 12.17 | -3.59 | |||
| Conservatives | 2,879 | 7.78 | -3.85 | |||
| People's Movement against the EU | 2,590 | 7.00 | +1.21 | |||
| Social Liberals | 2,550 | 6.89 | +3.00 | |||
| Liberal Alliance | 1,160 | 3.13 | +2.48 | |||
| Total | 37,002 | |||||
| Source[49] | ||||||
2009 European Parliament election in Denmark
| Parties | Vote | |||||
|---|---|---|---|---|---|---|
| Votes | % | + / - | ||||
| Venstre | 8,879 | 23.26 | +0.98 | |||
| Social Democrats | 8,611 | 22.56 | -8.89 | |||
| Green Left | 6,017 | 15.76 | +8.16 | |||
| Danish People's Party | 5,315 | 13.92 | +7.77 | |||
| Conservatives | 4,438 | 11.63 | +0.81 | |||
| People's Movement against the EU | 2,209 | 5.79 | +1.94 | |||
| Social Liberals | 1,486 | 3.89 | -2.13 | |||
| June Movement | 965 | 2.53 | -8.62 | |||
| Liberal Alliance | 250 | 0.65 | New | |||
| Total | 38,170 | |||||
| Source[50] | ||||||
2004 European Parliament election in Denmark
| Parties | Vote | |||||
|---|---|---|---|---|---|---|
| Votes | % | + / - | ||||
| Social Democrats | 6,075 | 31.45 | +15.41 | |||
| Venstre | 4,304 | 22.28 | -5.00 | |||
| June Movement | 2,153 | 11.15 | -6.35 | |||
| Conservatives | 2,090 | 10.82 | +3.32 | |||
| Green Left | 1,468 | 7.60 | +1.78 | |||
| Danish People's Party | 1,189 | 6.15 | +1.25 | |||
| Social Liberals | 1,162 | 6.02 | -2.89 | |||
| People's Movement against the EU | 744 | 3.85 | -2.44 | |||
| Christian Democrats | 133 | 0.69 | -0.76 | |||
| Total | 19,318 | |||||
| Source[51] | ||||||
1999 European Parliament election in Denmark
| Parties | Vote | |||||
|---|---|---|---|---|---|---|
| Votes | % | + / - | ||||
| Venstre | 5,451 | 27.28 | +4.56 | |||
| June Movement | 3,498 | 17.50 | +3.03 | |||
| Social Democrats | 3,206 | 16.04 | +1.77 | |||
| Social Liberals | 1,781 | 8.91 | +0.57 | |||
| Conservatives | 1,499 | 7.50 | -10.50 | |||
| People's Movement against the EU | 1,257 | 6.29 | -3.65 | |||
| Green Left | 1,163 | 5.82 | -2.85 | |||
| Danish People's Party | 980 | 4.90 | New | |||
| Centre Democrats | 860 | 4.30 | +3.60 | |||
| Christian Democrats | 290 | 1.45 | +0.98 | |||
| Progress Party | 95 | 0.48 | -1.92 | |||
| Total | 19,985 | |||||
| Source[52] | ||||||
1994 European Parliament election in Denmark
| Parties | Vote | |||||
|---|---|---|---|---|---|---|
| Votes | % | + / - | ||||
| Venstre | 4,739 | 22.72 | +3.03 | |||
| Conservatives | 3,754 | 18.00 | +3.42 | |||
| June Movement | 3,017 | 14.47 | New | |||
| Social Democrats | 2,977 | 14.27 | -7.63 | |||
| People's Movement against the EU | 2,074 | 9.94 | -8.43 | |||
| Green Left | 1,809 | 8.67 | +1.30 | |||
| Social Liberals | 1,739 | 8.34 | +5.29 | |||
| Progress Party | 500 | 2.40 | -3.29 | |||
| Centre Democrats | 147 | 0.70 | -7.19 | |||
| Christian Democrats | 99 | 0.47 | -0.99 | |||
| Total | 20,855 | |||||
| Source[53] | ||||||
1989 European Parliament election in Denmark
| Parties | Vote | |||||
|---|---|---|---|---|---|---|
| Votes | % | + / - | ||||
| Social Democrats | 3,709 | 21.90 | +2.78 | |||
| Venstre | 3,336 | 19.69 | +1.90 | |||
| People's Movement against the EU | 3,111 | 18.37 | -1.11 | |||
| Conservatives | 2,470 | 14.58 | -4.25 | |||
| Centre Democrats | 1,337 | 7.89 | +0.48 | |||
| Green Left | 1,249 | 7.37 | -1.05 | |||
| Progress Party | 963 | 5.69 | +2.70 | |||
| Social Liberals | 516 | 3.05 | -0.76 | |||
| Christian Democrats | 248 | 1.46 | +0.12 | |||
| Total | 16,939 | |||||
| Source[54] | ||||||
1984 European Parliament election in Denmark
| Parties | Vote | |||||
|---|---|---|---|---|---|---|
| Votes | % | |||||
| People's Movement against the EU | 3,585 | 19.48 | ||||
| Social Democrats | 3,517 | 19.12 | ||||
| Conservatives | 3,464 | 18.83 | ||||
| Venstre | 3,273 | 17.79 | ||||
| Green Left | 1,549 | 8.42 | ||||
| Centre Democrats | 1,363 | 7.41 | ||||
| Social Liberals | 701 | 3.81 | ||||
| Progress Party | 551 | 2.99 | ||||
| Christian Democrats | 246 | 1.34 | ||||
| Left Socialists | 150 | 0.82 | ||||
| Total | 18,399 | |||||
| Source[55] | ||||||
Referendums
2022 Danish European Union opt-out referendum[56]
| Option | Votes | % |
|---|---|---|
| ✓ YES | 34,031 | 72.03 |
| X NO | 13,214 | 27.97 |
2015 Danish European Union opt-out referendum[57]
| Option | Votes | % |
|---|---|---|
| ✓ YES | 23,967 | 51.83 |
| X NO | 22,274 | 48.17 |
2014 Danish Unified Patent Court membership referendum[58]
| Option | Votes | % |
|---|---|---|
| ✓ YES | 23,673 | 66.49 |
| X NO | 11,931 | 33.51 |
2009 Danish Act of Succession referendum[59]
| Option | Votes | % |
|---|---|---|
| ✓ YES | 31,467 | 87.86 |
| X NO | 4,347 | 12.14 |
2000 Danish euro referendum[60]
| Option | Votes | % |
|---|---|---|
| X NO | 17,581 | 50.22 |
| ✓ YES | 17,425 | 49.78 |
1998 Danish Amsterdam Treaty referendum[61]
| Option | Votes | % |
|---|---|---|
| ✓ YES | 17,507 | 58.08 |
| X NO | 12,636 | 41.92 |
1993 Danish Maastricht Treaty referendum[62]
| Option | Votes | % |
|---|---|---|
| ✓ YES | 20,289 | 60.95 |
| X NO | 12,998 | 39.05 |
1992 Danish Maastricht Treaty referendum[63]
| Option | Votes | % |
|---|---|---|
| ✓ YES | 16,569 | 52.47 |
| X NO | 15,012 | 47.53 |
1986 Danish Single European Act referendum[64]
| Option | Votes | % |
|---|---|---|
| ✓ YES | 17,112 | 61.57 |
| X NO | 10,680 | 38.43 |
1972 Danish European Communities membership referendum[65]
| Option | Votes | % |
|---|---|---|
| ✓ YES | 17,554 | 68.34 |
| X NO | 8,134 | 31.66 |
1953 Danish constitutional and electoral age referendum[66]
| Option | Votes | % |
|---|---|---|
| ✓ YES | 7,247 | 80.93 |
| X NO | 1,708 | 19.07 |
| 23 years | 5,304 | 58.25 |
| 21 years | 3,802 | 41.75 |
1939 Danish constitutional referendum[67]
| Option | Votes | % |
|---|---|---|
| ✓ YES | 4,480 | 84.74 |
| X NO | 807 | 15.26 |
References
- "Skanderborgkredsen". kmdvalg.dk (in Danish). Retrieved 2023-06-04.
- "Beretning om Forhandlingerne paa Rigsdagen". Rigsdagstidende. II: Spalte 3892 ff.
- "Nye valgkredse fordeler stemmerne anderledes". dr.dk (in Danish). Retrieved 2023-06-04.
- "Beretning om nye valgkredse som følge af kommunalreformen" (in Danish). Retrieved 2023-06-04.
- "Det danske valgsystem: Valg til Folketinget". valg.im (in Danish). Retrieved 2023-06-04.
- "70 Skanderborg". dataforsyningen.dk (in Danish). Retrieved 2023-06-04.
- "Beretning om Forhandlingerne paa Rigsdagen". Rigsdagstidende. II: Spalte 3892 ff.
- "Valgresultater fra tidligere valg:". kmdvalg (in Danish). Retrieved 2023-06-04.
- "FOLKETINGSVALG TIRSDAG 1. NOVEMBER 2022". valg.im (in Danish). Retrieved 2023-06-27.
- "FOLKETINGSVALG ONSDAG 5. JUNI 2019". valg.im (in Danish). Retrieved 2023-06-27.
- "FOLKETINGSVALG TORSDAG 18. JUNI 2015". valg.im (in Danish). Retrieved 2023-06-27.
- "FOLKETINGSVALG TORSDAG 15. SEPTEMBER 2011". valg.im (in Danish). Retrieved 2023-06-27.
- "Folketingsvalget den 13. november 2007". valg.im (in Danish). Retrieved 2023-06-27.
- "valg2005.book" (PDF). valg.im (in Danish). Retrieved 2023-06-27.
- "BMTABEL" (PDF). valg.im (in Danish). Retrieved 2023-06-27.
- "VALG98" (PDF). valg.im (in Danish). Retrieved 2023-06-27.
- "VALG94" (PDF). valg.im (in Danish). Retrieved 2023-06-27.
- "VALG90" (PDF). valg.im (in Danish). Retrieved 2023-06-27.
- "Folketingsvalget den 10. maj 1988". valg.im (in Danish). Retrieved 2023-06-27.
- "Folketingsvalget den 8.september 1987". dst.dk (in Danish). Retrieved 2023-06-27.
- "Folketingsvalget den 10. januar 1984". dst.dk (in Danish). Retrieved 2023-06-27.
- "Folketingsvalget den 8. december 1981". dst.dk (in Danish). Retrieved 2023-06-27.
- "Folketingsvalget den 23. oktober 1979". dst.dk (in Danish). Retrieved 2023-06-27.
- "Folketingsvalget den 15. februar 1977". dst.dk (in Danish). Retrieved 2023-06-27.
- "Folketingsvalget den 9. januar 1975". dst.dk (in Danish). Retrieved 2023-06-27.
- "Folketingsvalget den 4. december 1973". dst.dk (in Danish). Retrieved 2023-06-27.
- "Folketingsvalget den 21. september 1971 samt folkeafstemningen". dst.dk (in Danish). Retrieved 2023-06-27.
- "Folketingsvalget den 23. januar 1968". dst.dk (in Danish). Retrieved 2023-06-27.
- "Folketingsvalget den 22. november 1966". dst.dk (in Danish). Retrieved 2023-06-27.
- "Folketingsvalget den 22. september 1964". dst.dk (in Danish). Retrieved 2023-06-27.
- "Folketingsvalget den 15. november 1960". dst.dk (in Danish). Retrieved 2023-06-27.
- "Folketingsvalget den 14. maj 1957". dst.dk (in Danish). Retrieved 2023-06-27.
- "Folketingsvalget den 22. september 1953". dst.dk (in Danish). Retrieved 2023-06-27.
- "Rigsdagsvalgene og folkeafstemningerne i april og maj 1953". dst.dk (in Danish). Retrieved 2023-06-27.
- "Folketingsvalget den 5. september 1950". dst.dk (in Danish). Retrieved 2023-06-27.
- "Folketingsvalget den 28. oktober 1947". dst.dk (in Danish). Retrieved 2023-06-27.
- "Rigsdagsvalgene i oktober og november 1945". dst.dk (in Danish). Retrieved 2023-06-27.
- "Rigsdagsvalgene i marts og april 1943". dst.dk (in Danish). Retrieved 2023-06-27.
- "Rigsdagsvalgene og Folkeafstemningen i april og maj 1939". dst.dk (in Danish). Retrieved 2023-06-27.
- "Folketingsvalget den 22. oktober 1935". dst.dk (in Danish). Retrieved 2023-06-27.
- "Folketingsvalget den 16. november 1932". dst.dk (in Danish). Retrieved 2023-06-27.
- "Folketingsvalget den 24. april 1929". dst.dk (in Danish). Retrieved 2023-06-27.
- "Folketingsvalget den 2. december 1926". dst.dk (in Danish). Retrieved 2023-06-27.
- "Folketingsvalget den 11. april 1924". dst.dk (in Danish). Retrieved 2023-06-27.
- "Rigsdagsvalgene september-oktober 1920". dst.dk (in Danish). Retrieved 2023-06-27.
- "Rigsdagsvalgene juli-august 1920". dst.dk (in Danish). Retrieved 2023-06-27.
- "Folketingsvalget den 26. april 1920". dst.dk (in Danish). Retrieved 2023-06-27.
- "EUROPA-PARLAMENTSVALG SØNDAG 26. MAJ 2019". dst.dk (in Danish). Retrieved 2023-07-01.
- "EUROPA-PARLAMENTSVALG SØNDAG 25. MAJ 2014". dst.dk (in Danish). Retrieved 2023-07-01.
- "EUROPA-PARLAMENTSVALG SØNDAG 7. JUNI 2009". dst.dk (in Danish). Retrieved 2023-07-01.
- "EUROPA-PARLAMENTSVALGET DEN 13. JUNI 2004" (PDF). im.dk (in Danish). Retrieved 2023-07-01.
- "VALGET TIL EUROPA-PARLAMENTET DEN 10. JUNI 1999" (PDF). im.dk (in Danish). Retrieved 2023-07-01.
- "VALGET TIL EUROPA-PARLAMENTET DEN 9. JUNI 1994" (PDF). im.dk (in Danish). Retrieved 2023-07-01.
- "Valget til Europa-parlamentet den 15. juni 1989". dst.dk (in Danish). Retrieved 2023-07-01.
- "Valget til Europa-Parlamentet den 14. juni 1984". dst.dk (in Danish). Retrieved 2023-07-01.
- "FOLKEAFSTEMNING ONSDAG 1. JUNI 2022". dst.dk (in Danish). Retrieved 2023-07-05.
- "FOLKEAFSTEMNING TORSDAG 3. DECEMBER 2015". dst.dk (in Danish). Retrieved 2023-07-05.
- "FOLKEAFSTEMNING SØNDAG 25. MAJ 2014". dst.dk (in Danish). Retrieved 2023-07-05.
- "FOLKEAFSTEMNING SØNDAG 7. JUNI 2009". dst.dk (in Danish). Retrieved 2023-07-05.
- "FOLKEAFSTEMNINGEN DEN 28. SEPTEMBER 2000 OM DANMARKS DELTAGELSE I DEN FÆLLES VALUTA" (PDF). valg.im (in Danish). Retrieved 2023-07-05.
- "FOLKEAFSTEMNINGEN DEN 28. MAJ 1998OM DANMARKS TILTRÆDELSE AF AMSTERDAMTRAKTATEN" (PDF). valg.im (in Danish). Retrieved 2023-07-05.
- "FOLKEAFSTEMNINGEN DEN 18. MAJ 1993 OM DANMARKS TILTRÆDELSE AF EDINBURGH-AFGØRELSEN OG MAASTRICHT-TRAKTATEN". dst.dk (in Danish). Retrieved 2023-07-05.
- "Folkeafstemningen den 1. juni 1992 om Danmarks tiltrædelse af traktaten om Den Europæiske Union". dst.dk (in Danish). Retrieved 2023-07-05.
- "Vejledende folkeafstemning torsdag den 27. februar 1986 om Danmarks tiltrædelse af EF- pakken". dst.dk (in Danish). Retrieved 2023-07-05.
- "Folkeafstemningen om Danmarks tiltrædelse af De europæiske Fælleskaber 2. oktober 1972". dst.dk (in Danish). Retrieved 2023-07-05.
- "Publikationsfortegnelse vedrørende Folkeafstemninger". dst.dk (in Danish). Retrieved 2023-07-05.
- "Publikationsfortegnelse vedrørende Folkeafstemninger". dst.dk (in Danish). Retrieved 2023-07-05.