Skellefteå Municipality
Skellefteå Municipality (Swedish: Skellefteå kommun) is a municipality in Västerbotten County in northern Sweden. Its seat is located in Skellefteå.
Skellefteå Municipality
Skellefteå kommun | |
|---|---|
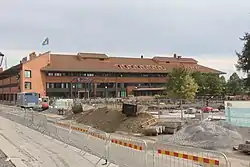 Skellefteå town hall | |
 Coat of arms | |
 | |
| Coordinates: 64°45′N 20°59′E | |
| Country | Sweden |
| County | Västerbotten County |
| Seat | Skellefteå |
| Area | |
| • Total | 9,955.58 km2 (3,843.87 sq mi) |
| • Land | 6,802.85 km2 (2,626.60 sq mi) |
| • Water | 3,152.73 km2 (1,217.28 sq mi) |
| Area as of 1 January 2014. | |
| Population (31 December 2021)[2] | |
| • Total | 73,393 |
| • Density | 7.4/km2 (19/sq mi) |
| Time zone | UTC+1 (CET) |
| • Summer (DST) | UTC+2 (CEST) |
| ISO 3166 code | SE |
| Province | Västerbotten |
| Municipal code | 2482 |
| Website | www.skelleftea.se |
History
Most of the amalgamations leading to the present municipality took place in 1967 when the then "City of Skellefteå" was merged with the rural municipality by the same name and also with the municipalities Jörn, Bureå and Byske. The enlarged city became a municipality of unitary type with the new local government act in 1971, and in 1974 the municipalities Burträsk and Lövånger were added.
Geography
The municipality borders in the south to Robertsfors Municipality, and clockwise to Umeå, Vindeln, Norsjö, Arvidsjaur and Piteå municipalities. Skellefteå is the largest coastline municipality by area, being roughly 15 percent larger than the second largest, Örnsköldsvik Municipality.
Skellefteå is situated around Skellefte River, a river that runs through the city. There is also a very central mountain, Vitberget, which is popular for skiing in the wintertime, and hiking in the summer.
Localities
There are 20 localities (or urban areas) in Skellefteå Municipality:[3]
| # | Locality | Population |
|---|---|---|
| 1 | Skellefteå | 32,425 |
| 2 | Ursviken | 4,054 |
| 3 | Skelleftehamn | 3,120 |
| 4 | Bureå | 2,345 |
| 5 | Kåge | 2,205 |
| 6 | Bergsbyn | 1,818 |
| 7 | Byske | 1,731 |
| 8 | Burträsk | 1,632 |
| 9 | Boliden | 1,515 |
| 10 | Jörn | 877 |
| 11 | Ersmark | 865 |
| 12 | Lövånger | 779 |
| 13 | Medle | 558 |
| 14 | Kusmark | 437 |
| 15 | Örviken | 411 |
| 16 | Södra Bergsbyn och Stackgrönnan | 406 |
| 17 | Ostvik | 392 |
| 18 | Bygdsiljum | 370 |
| 19 | Drängsmark | 353 |
| 20 | Myckle | 343 |
The municipal seat in bold
Economy
The largest employer in Skellefteå Municipality is the mining company Boliden AB, with about 1,200 employees.
Elections
Riksdag
These are the results of the elections to the Riksdag for Kiruna Municipality since the 1972 municipal reform. SCB did not publish the party's results for the Sweden Democrats between 1988 and 1998 because of the party's small size nationally.
| Year | Turnout | Votes | V | S | MP | C | L | KD | M | SD | ND |
|---|---|---|---|---|---|---|---|---|---|---|---|
| 1973[4] | 89.9 | 45,977 | 3.8 | 49.4 | 0.0 | 24.8 | 9.1 | 3.7 | 8.6 | 0.0 | 0.0 |
| 1976[5] | 90.7 | 49,133 | 3.4 | 49.8 | 0.0 | 24.8 | 9.7 | 3.1 | 8.8 | 0.0 | 0.0 |
| 1979[6] | 90.8 | 49,788 | 4.1 | 51.3 | 0.0 | 20.6 | 10.0 | 3.3 | 10.1 | 0.0 | 0.0 |
| 1982[7] | 90.9 | 50,472 | 4.1 | 54.5 | 0.9 | 18.6 | 6.8 | 3.6 | 11.3 | 0.0 | 0.0 |
| 1985[8] | 89.8 | 50,354 | 4.9 | 53.1 | 0.8 | 17.4 | 13.7 | 0.0 | 9.6 | 0.0 | 0.0 |
| 1988[9] | 86.5 | 48,522 | 5.4 | 52.9 | 3.5 | 14.3 | 10.9 | 5.0 | 7.2 | 0.0 | 0.0 |
| 1991[10] | 87.2 | 49,170 | 4.8 | 50.6 | 2.3 | 13.1 | 9.0 | 8.3 | 8.9 | 0.0 | 2.8 |
| 1994[11] | 88.0 | 50,073 | 7.4 | 57.1 | 4.7 | 9.6 | 6.9 | 4.6 | 8.9 | 0.0 | 0.3 |
| 1998[12] | 83.0 | 46,467 | 15.5 | 48.5 | 4.0 | 6.2 | 4.8 | 10.2 | 9.1 | 0.0 | 0.0 |
| 2002[13] | 81.4 | 44,967 | 11.4 | 50.6 | 3.5 | 10.2 | 9.4 | 8.4 | 5.0 | 0.4 | 0.0 |
| 2006[14] | 83.3 | 45,981 | 8.9 | 50.3 | 4.3 | 10.1 | 6.0 | 6.3 | 11.0 | 1.4 | 0.0 |
| 2010[15] | 85.6 | 48,020 | 9.5 | 49.6 | 5.8 | 6.0 | 5.7 | 5.4 | 14.3 | 2.9 | 0.0 |
| 2014[16] | 86.7 | 48,779 | 9.3 | 50.2 | 5.3 | 5.8 | 3.8 | 4.0 | 10.7 | 7.8 | 0.0 |
Blocs
This lists the relative strength of the socialist and centre-right blocs since 1973, but parties not elected to the Riksdag are inserted as "other", including the Sweden Democrats results from 1988 to 2006, but also the Christian Democrats pre-1991 and the Greens in 1982, 1985 and 1991. The sources are identical to the table above. The coalition or government mandate marked in bold formed the government after the election. New Democracy got elected in 1991 but are still listed as "other" due to the short lifespan of the party.
| Year | Turnout | Votes | Left | Right | SD | Other | Elected |
|---|---|---|---|---|---|---|---|
| 1973 | 89.9 | 45,977 | 53.2 | 42.5 | 0.0 | 4.3 | 95.7 |
| 1976 | 90.7 | 49,133 | 53.2 | 43.3 | 0.0 | 3.5 | 96.5 |
| 1979 | 90.8 | 49,788 | 55.4 | 40.7 | 0.0 | 3.9 | 96.1 |
| 1982 | 90.9 | 50,472 | 58.6 | 36.7 | 0.0 | 4.7 | 95.3 |
| 1985 | 89.8 | 50,354 | 58.0 | 39.7 | 0.0 | 2.1 | 97.7 |
| 1988 | 86.5 | 48,522 | 61.8 | 32.4 | 0.0 | 5.8 | 94.2 |
| 1991 | 87.2 | 49,170 | 55.4 | 39.3 | 0.0 | 5.3 | 97.5 |
| 1994 | 88.0 | 50,073 | 69.2 | 30.0 | 0.0 | 0.8 | 99.2 |
| 1998 | 83.0 | 46,467 | 68.0 | 30.3 | 0.0 | 1.7 | 98.3 |
| 2002 | 81.4 | 44,967 | 65.5 | 33.0 | 0.0 | 3.5 | 96.5 |
| 2006 | 83.3 | 45,981 | 63.5 | 33.4 | 0.0 | 3.1 | 96.9 |
| 2010 | 85.6 | 48,020 | 64.9 | 31.4 | 2.9 | 0.8 | 99.2 |
| 2014 | 86.7 | 48,779 | 64.8 | 24.3 | 7.8 | 3.1 | 96.9 |
Demographics
2022 by district
This is a demographic table based on Skellefteå Municipality's electoral districts in the 2022 Swedish general election sourced from SVT's election platform, in turn taken from SCB official statistics.[17]
Residents include everyone registered as living in the district, regardless of age or citizenship status.[17] Valid voters indicate Swedish citizens above the age of 18 who therefore can vote in general elections.[17] Left vote and right vote indicate the result between the two major blocs in said district in the 2022 general election. Employment indicates the share of people between the ages of 20 and 64 who are working taxpayers.[17] Foreign background denotes residents either born abroad or with two parents born outside of Sweden.[17] Median income is the received monthly income through either employment, capital gains or social grants for the median adult above 20, also including pensioners in Swedish kronor.[17] College graduates indicates any degree accumulated after high school.[17]
There were 73,333 residents, of whom 56,888 were Swedish citizens of voting age.[17] 63.1 % voted for the left coalition and 35.7 % for the right coalition.
| Location | Residents | Valid voters | Left vote | Right vote | Employed | SV parents | 1st/2nd gen | Income | College |
|---|---|---|---|---|---|---|---|---|---|
| % | % | % | % | % | % | ||||
| Alhem-Norrbacka | 1,386 | 1,183 | 62.9 | 36.4 | 86 | 93 | 7 | 28,511 | 48 |
| Anderstorp N | 1,334 | 1,053 | 66.0 | 33.0 | 71 | 77 | 23 | 21,600 | 33 |
| Anderstorp S | 1,680 | 1,131 | 69.8 | 29.2 | 80 | 85 | 15 | 23,768 | 33 |
| Anderstorp Ö | 1,581 | 1,437 | 70.3 | 27.8 | 67 | 73 | 27 | 21,206 | 36 |
| Bergsbyn | 1,764 | 1,290 | 63.0 | 36.1 | 91 | 95 | 5 | 29,755 | 48 |
| Boliden | 2,038 | 1,400 | 56.8 | 41.2 | 72 | 73 | 27 | 22,211 | 28 |
| Brännan-Mobacken | 1,782 | 1,350 | 68.8 | 30.7 | 86 | 93 | 7 | 28,970 | 57 |
| Bureå N | 1,484 | 1,114 | 69.4 | 29.3 | 82 | 92 | 8 | 24,256 | 34 |
| Bureå S | 1,373 | 1,021 | 57.8 | 40.5 | 81 | 87 | 13 | 25,274 | 31 |
| Burträsk C | 1,822 | 1,389 | 63.4 | 35.9 | 80 | 85 | 15 | 21,938 | 25 |
| Burträskbygden | 2,327 | 1,852 | 59.8 | 39.3 | 83 | 92 | 8 | 25,042 | 32 |
| Byske C | 1,792 | 1,370 | 60.7 | 37.5 | 80 | 87 | 13 | 22,630 | 28 |
| Byske-Fällfors | 1,440 | 1,239 | 57.0 | 42.0 | 85 | 94 | 6 | 23,842 | 24 |
| Centrum N | 1,411 | 1,327 | 59.1 | 39.8 | 81 | 88 | 12 | 26,935 | 44 |
| Centrum S | 1,714 | 1,529 | 65.1 | 33.9 | 76 | 89 | 11 | 24,095 | 47 |
| Drängsmark-Ostvik | 1,761 | 1,338 | 60.2 | 39.3 | 87 | 97 | 3 | 28,124 | 31 |
| Erikslid | 1,903 | 1,606 | 67.6 | 31.9 | 79 | 90 | 10 | 25,245 | 48 |
| Getberget-Norrvalla | 1,558 | 1,310 | 67.2 | 32.0 | 85 | 90 | 10 | 26,782 | 41 |
| Hjoggböle | 1,515 | 1,154 | 55.4 | 43.1 | 88 | 96 | 4 | 26,466 | 33 |
| Jörn | 1,229 | 975 | 63.1 | 36.3 | 75 | 85 | 15 | 20,833 | 24 |
| Kåge N | 1,470 | 1,071 | 63.7 | 35.9 | 89 | 92 | 8 | 27,248 | 40 |
| Kåge S | 1,677 | 1,318 | 57.3 | 42.1 | 87 | 95 | 5 | 29,053 | 41 |
| Kågedalen | 2,112 | 1,642 | 57.5 | 41.8 | 90 | 95 | 5 | 26,915 | 27 |
| Lövånger | 2,141 | 1,613 | 63.1 | 36.0 | 79 | 84 | 16 | 21,900 | 34 |
| Morö Backe C | 1,628 | 1,161 | 67.3 | 31.2 | 62 | 68 | 32 | 17,689 | 22 |
| Morö Backe V | 1,307 | 916 | 61.3 | 38.3 | 94 | 92 | 8 | 30,028 | 53 |
| Morö Backe Ö | 1,767 | 1,247 | 65.0 | 34.4 | 88 | 91 | 9 | 29,119 | 47 |
| Moröhöjden | 1,135 | 1,028 | 64.8 | 35.2 | 83 | 90 | 10 | 24,480 | 38 |
| Morön-Hedensbyn | 1,520 | 1,101 | 70.6 | 28.7 | 92 | 94 | 6 | 30,890 | 49 |
| Myckle-Medle | 1,189 | 893 | 60.9 | 38.0 | 89 | 95 | 5 | 28,826 | 49 |
| Norrhammar | 1,524 | 1,334 | 67.2 | 32.1 | 84 | 91 | 9 | 26,974 | 47 |
| Prästbordet | 1,803 | 1,519 | 65.7 | 33.3 | 83 | 89 | 11 | 25,213 | 43 |
| Sjungande Dalen | 1,763 | 1,368 | 68.7 | 30.4 | 80 | 83 | 17 | 24,444 | 47 |
| Skelleftehamn V | 1,501 | 1,028 | 61.3 | 37.2 | 78 | 80 | 20 | 24,371 | 25 |
| Skelleftehamn Ö | 1,736 | 1,224 | 65.2 | 32.0 | 71 | 74 | 26 | 21,528 | 26 |
| Skråmträsk-Klutmark | 1,381 | 1,066 | 54.9 | 44.1 | 88 | 95 | 5 | 28,028 | 36 |
| Stackgrännan-Örviken | 1,592 | 1,183 | 58.3 | 40.1 | 91 | 94 | 6 | 30,052 | 43 |
| Stämningsgården | 1,629 | 1,187 | 65.2 | 34.0 | 83 | 90 | 10 | 28,270 | 46 |
| Sunnanå C | 2,033 | 1,508 | 67.3 | 32.1 | 88 | 93 | 7 | 28,848 | 54 |
| Sunnanå S | 1,682 | 1,329 | 62.9 | 36.1 | 88 | 94 | 6 | 30,161 | 48 |
| Sörböle | 1,301 | 944 | 64.8 | 34.3 | 86 | 91 | 9 | 29,729 | 47 |
| Ursviken | 2,400 | 1,810 | 62.9 | 35.5 | 85 | 91 | 9 | 26,883 | 38 |
| Yttre Ursviken | 1,586 | 1,156 | 66.5 | 32.3 | 90 | 94 | 6 | 29,447 | 44 |
| Älvsbacka V | 1,288 | 1,112 | 62.4 | 36.3 | 80 | 85 | 15 | 25,341 | 44 |
| Älvsbacka Ö | 1,274 | 1,062 | 63.3 | 35.9 | 86 | 91 | 9 | 29,144 | 48 |
| Source: SVT[17] | |||||||||
Twin towns – sister cities
Skellefteå is twinned with:[18]
 Pardubice, Czech Republic
 Raahe, Finland
 Rana, Norway
 Tongling, China
 Vesthimmerland, Denmark
Notable natives
- Jan Erixon, ice hockey player
- Andreas Hedlund, musician
- Stieg Larsson, journalist and author of The Girl with the Dragon Tattoo
- Joakim Nyström, tennis player
- Victoria Silvstedt, model
- Margot Wallström, politician
- The Wannadies, pop group
See also
- Norra Västerbotten, local newspaper
- Skellefteå AIK, local ice hockey club
References
- "Statistiska centralbyrån, Kommunarealer den 1 januari 2014" (in Swedish). Statistics Sweden. 1 January 2014. Archived from the original (Microsoft Excel) on 27 September 2016. Retrieved 18 April 2014.
- "Folkmängd i riket, län och kommuner 31 december 2021" (in Swedish). Statistics Sweden. 22 February 2022. Retrieved 22 February 2022.
- Statistics Sweden as of December 31, 2005
- "Riksdagsvalet 1973 (page 168)" (PDF) (in Swedish). SCB. Retrieved 18 August 2017.
- "Riksdagsvalet 1976 (page 163)" (PDF) (in Swedish). SCB. Retrieved 18 August 2017.
- "Riksdagsvalet 1979 (page 187)" (PDF) (in Swedish). SCB. Retrieved 18 August 2017.
- "Riksdagsvalet 1982 (page 188)" (PDF) (in Swedish). SCB. Retrieved 18 August 2017.
- "Riksdagsvalet 1985 (page 189)" (PDF) (in Swedish). SCB. Retrieved 18 August 2017.
- "Riksdagsvalet 1988 (page 169)" (PDF) (in Swedish). SCB. Retrieved 18 August 2017.
- "Riksdagsvalet 1991 (page 31)" (PDF) (in Swedish). SCB. Retrieved 18 August 2017.
- "Riksdagsvalet 1994 (page 45)" (PDF) (in Swedish). SCB. Retrieved 18 August 2017.
- "Riksdagsvalet 1998 (page 43)" (PDF) (in Swedish). SCB. Retrieved 18 August 2017.
- "Valresultat Riksdag Skellefteå kommun 2002" (in Swedish). Valmyndigheten. Retrieved 18 August 2017.
- "Valresultat Riksdag Skellefteå kommun 2006" (in Swedish). Valmyndigheten. Retrieved 18 August 2017.
- "Valresultat Riksdag Skellefteå kommun 2010" (in Swedish). Valmyndigheten. Retrieved 18 August 2017.
- "Valresultat Riksdag Skellefteå kommun 2014" (in Swedish). Valmyndigheten. Retrieved 18 August 2017.
- "Valresultat 2022 för Skellefteå i riksdagsvalet". SVT. 11 September 2022. Retrieved 25 January 2023.
- Official site (in Swedish)
External links
- Skellefteå Municipality – Official site (in Swedish)
- Tourism site (in Swedish)