Skipton and Ripon (UK Parliament constituency)
Skipton and Ripon is a constituency[n 1] in North Yorkshire represented in the House of Commons of the UK Parliament since 2010 by Julian Smith, a Conservative.[n 2]
| Skipton and Ripon | |
|---|---|
| County constituency for the House of Commons | |
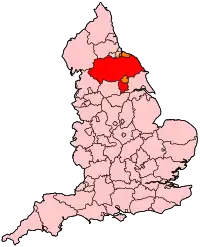
 Boundary of Skipton and Ripon in North Yorkshire | |
 Location of North Yorkshire within England | |
| County | North Yorkshire |
| Electorate | 77,541 (December 2019)[1] |
| Major settlements | Masham, Ripon, Settle, Skipton |
| Current constituency | |
| Created | 1983 |
| Member of Parliament | Julian Smith (Conservative) |
| Seats | One |
| Created from | Skipton, Ripon, Harrogate, Thirsk & Malton, Keighley, Barkston Ash and Richmond (Yorks)[2] |
Constituency profile
The constituency covers a mainly rural area of the Yorkshire Dales. The largest settlements are the town of Skipton and the city of Ripon. Smaller towns in the constituency are Bentham, Settle, Pateley Bridge and Masham.
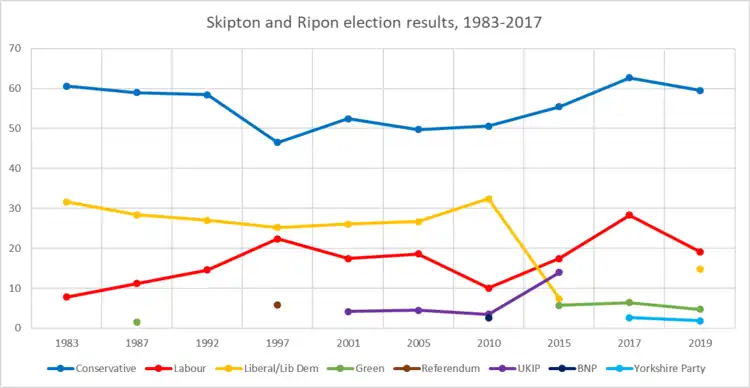
It is one of the safest seats in England, formed on an area with a long history of Conservative representation and with a large majority of its electorate having in the last election voted Conservative. It was also the constituency in 1992 that when declared, saw the Conservatives gain the 4th straight majority since 1979 and John Major re-elected as Prime Minister.
At 1.6%, Skipton and Ripon had significantly lower than national average unemployment (3.8%) in November 2012.[3]
Boundaries
1983–1997: The District of Craven, and the Borough of Harrogate wards of Almscliffe, Bishop Monkton, Boroughbridge, Fountains, Killinghall, Kirkby Malzeard, Lower Nidderdale, Mashamshire, Newby, Nidd Valley, Pateley Bridge, Ripon East, Ripon West, Wathvale, and Wharfedale Moors.
1997–2010: The District of Craven, and the Borough of Harrogate wards of Almscliffe, Bishop Monkton, Fountains, Killinghall, Kirkby Malzeard, Lower Nidderdale, Mashamshire, Nidd Valley, Pateley Bridge, Ripon East, Ripon West, and Wharfedale Moors.
2010–present: The District of Craven, and the Borough of Harrogate wards of Bishop Monkton, Kirkby Malzeard, Lower Nidderdale, Mashamshire, Newby, Nidd Valley, Pateley Bridge, Ripon Minster, Ripon Moorside, Ripon Spa, Washburn, and Wathvale.
This area of the Yorkshire Dales covers the whole of the Craven district and the northern and western parts of the Borough of Harrogate district.
History
The constituency was created in 1983 from the parts of the former seats of Skipton and Ripon within the county of North Yorkshire.
Members of Parliament
| Election | Member[4] | Party | |
|---|---|---|---|
| 1983 | John Watson | Conservative | |
| 1987 | David Curry | Conservative | |
| 2010 | Julian Smith | Conservative | |
Elections

Elections in the 2010s
| Party | Candidate | Votes | % | ±% | |
|---|---|---|---|---|---|
| Conservative | Julian Smith | 34,919 | 59.5 | ―3.2 | |
| Labour | Brian McDaid | 11,225 | 19.1 | ―9.2 | |
| Liberal Democrats | Andrew Murday | 8,701 | 14.8 | New | |
| Green | Andy Brown | 2,748 | 4.7 | ―1.7 | |
| Yorkshire | Jack Render | 1,131 | 1.9 | ―0.7 | |
| Majority | 23,694 | 40.4 | +6.0 | ||
| Turnout | 58,724 | 74.6 | +0.2 | ||
| Conservative hold | Swing | +3.0 | |||
| Party | Candidate | Votes | % | ±% | |
|---|---|---|---|---|---|
| Conservative | Julian Smith | 36,425 | 62.7 | +7.3 | |
| Labour | Alan Woodhead | 16,440 | 28.3 | +10.9 | |
| Green | Andy Brown | 3,734 | 6.4 | +0.7 | |
| Yorkshire | Jack Render | 1,539 | 2.6 | New | |
| Majority | 19,985 | 34.4 | ―3.6 | ||
| Turnout | 58,138 | 74.4 | +6.8 | ||
| Conservative hold | Swing | ―1.8 | |||
In 2017, the Liberal Democrats stood aside and endorsed the Green Party.[7]
| Party | Candidate | Votes | % | ±% | |
|---|---|---|---|---|---|
| Conservative | Julian Smith | 30,248 | 55.4 | +4.8 | |
| Labour | Malcolm Birks | 9,487 | 17.4 | +7.4 | |
| UKIP | Alan Henderson | 7,651 | 14.0 | +10.5 | |
| Liberal Democrats | Jacquie Bell | 4,057 | 7.4 | ―25.0 | |
| Green | Andy Brown | 3,116 | 5.7 | New | |
| Majority | 20,761 | 38.0 | +19.8 | ||
| Turnout | 54,559 | 71.6 | +0.9 | ||
| Conservative hold | Swing | ―1.2 | |||
| Party | Candidate | Votes | % | ±% | |
|---|---|---|---|---|---|
| Conservative | Julian Smith | 27,685 | 50.6 | +0.6 | |
| Liberal Democrats | Helen Flynn | 17,735 | 32.4 | +5.8 | |
| Labour | Claire Hazelgrove | 5,498 | 10.0 | ―8.2 | |
| UKIP | Rodney Mills | 1,909 | 3.5 | ―1.1 | |
| BNP | Bernard Allen | 1,403 | 2.6 | New | |
| Independent | Roger Bell | 315 | 0.6 | New | |
| The Youth Party | Dylan Gilligan | 95 | 0.2 | New | |
| Virtue Currency Cognitive Appraisal Party | Bob Leakey | 84 | 0.2 | ―0.4 | |
| Majority | 9,950 | 18.2 | ―4.8 | ||
| Turnout | 54,724 | 70.7 | +4.6 | ||
| Conservative hold | Swing | ―2.6 | |||
Elections in the 2000s
| Party | Candidate | Votes | % | ±% | |
|---|---|---|---|---|---|
| Conservative | David Curry | 25,100 | 49.7 | ―2.7 | |
| Liberal Democrats | Paul English | 13,480 | 26.7 | +0.6 | |
| Labour | Paul Baptie | 9,393 | 18.6 | +1.2 | |
| UKIP | Ian Bannister | 2,274 | 4.5 | +0.3 | |
| Virtue Currency Cognitive Appraisal Party | Bob Leakey | 274 | 0.5 | New | |
| Majority | 11,620 | 23.0 | ―3.3 | ||
| Turnout | 50,521 | 72.6 | +6.5 | ||
| Conservative hold | Swing | ||||
| Party | Candidate | Votes | % | ±% | |
|---|---|---|---|---|---|
| Conservative | David Curry | 25,736 | 52.4 | +5.9 | |
| Liberal Democrats | Bernard Bateman | 12,806 | 26.1 | +0.9 | |
| Labour | Michael Dugher | 8,543 | 17.4 | ―5.0 | |
| UKIP | Nancy Holdsworth | 2,041 | 4.2 | New | |
| Majority | 12,930 | 26.3 | +5.0 | ||
| Turnout | 49,126 | 66.1 | ―8.6 | ||
| Conservative hold | Swing | ||||
Elections in the 1990s
| Party | Candidate | Votes | % | ±% | |
|---|---|---|---|---|---|
| Conservative | David Curry | 25,294 | 46.5 | ―11.9 | |
| Liberal Democrats | Thomas Mould | 13,674 | 25.2 | ―1.8 | |
| Labour | Robert Marchant | 12,171 | 22.4 | +7.8 | |
| Referendum | Nancy Holdsworth | 3,212 | 5.9 | New | |
| Majority | 11,620 | 21.3 | ―10.1 | ||
| Turnout | 54,351 | 74.7 | ―6.6 | ||
| Conservative hold | Swing | ―5.1 | |||
| Party | Candidate | Votes | % | ±% | |
|---|---|---|---|---|---|
| Conservative | David Curry | 35,937 | 58.4 | ―0.6 | |
| Liberal Democrats | Richard Hall | 16,607 | 27.0 | ―1.4 | |
| Labour | Katharine Allott | 8,978 | 14.6 | +3.4 | |
| Majority | 19,330 | 31.4 | +0.8 | ||
| Turnout | 61,522 | 81.3 | +3.5 | ||
| Conservative hold | Swing | +0.4 | |||
Elections in the 1980s
| Party | Candidate | Votes | % | ±% | |
|---|---|---|---|---|---|
| Conservative | David Curry | 33,128 | 59.0 | ―1.6 | |
| Liberal | Stephen Cooksey | 15,954 | 28.4 | ―3.2 | |
| Labour | Timothy Whitfield | 6,264 | 11.2 | +3.4 | |
| Green | Linda Williams | 825 | 1.5 | New | |
| Majority | 17,174 | 30.6 | +1.6 | ||
| Turnout | 56,171 | 77.8 | +2.9 | ||
| Conservative hold | Swing | +0.9 | |||
| Party | Candidate | Votes | % | ±% | |
|---|---|---|---|---|---|
| Conservative | John Watson | 31,509 | 60.6 | ||
| Liberal | Claire Brooks | 16,463 | 31.6 | ||
| Labour | Margaret Billing | 4,044 | 7.8 | ||
| Majority | 15,046 | 29.0 | |||
| Turnout | 52,016 | 74.9 | |||
| Conservative win (new seat) | |||||
Notes
- A county constituency (for the purposes of election expenses and type of returning officer)
- As with all constituencies, the constituency elects one Member of Parliament (MP) by the first past the post system of election at least every five years.
References
- "Constituency data: electorates – House of Commons Library". Parliament UK. 15 June 2020. Retrieved 22 July 2020.
- "'Skipton and Ripon', June 1983 up to May 1997". ElectionWeb Project. Cognitive Computing Limited. Retrieved 14 March 2016.
- Unemployment claimants by constituency The Guardian
- Leigh Rayment's Historical List of MPs – Constituencies beginning with "S" (part 2)
- "Statement of persons nominated and notice of poll" (PDF). Craven District Council. 14 November 2019. Retrieved 15 November 2019.
- "Skipton & Ripon parliamentary constituency - Election 2017" – via www.bbc.co.uk.
- "GENERAL ELECTION: Historic deal sees Lib/Dems stand down in Skipton and Ripon to make way for Greens". Craven Herald.
- "Election Data 2015". Electoral Calculus. Archived from the original on 17 October 2015. Retrieved 17 October 2015.
- "Skipton & Ripon". BBC News. Retrieved 13 May 2015.
- "Election Data 2010". Electoral Calculus. Archived from the original on 26 July 2013. Retrieved 17 October 2015.
- "UK > England > Yorkshire & the Humber > Skipton & Ripon". Election 2010. BBC. 7 May 2010. Retrieved 11 May 2010.
- "Election Data 2005". Electoral Calculus. Archived from the original on 15 October 2011. Retrieved 18 October 2015.
- "Election Data 2001". Electoral Calculus. Archived from the original on 15 October 2011. Retrieved 18 October 2015.
- "Election Data 1997". Electoral Calculus. Archived from the original on 15 October 2011. Retrieved 18 October 2015.
- "Election Data 1992". Electoral Calculus. Archived from the original on 15 October 2011. Retrieved 18 October 2015.
- "Politics Resources". Election 1992. Politics Resources. 9 April 1992. Retrieved 6 December 2010.
- "Election Data 1987". Electoral Calculus. Archived from the original on 15 October 2011. Retrieved 18 October 2015.
- "Election Data 1983". Electoral Calculus. Archived from the original on 15 October 2011. Retrieved 18 October 2015.