Slide Mountain (Nevada)
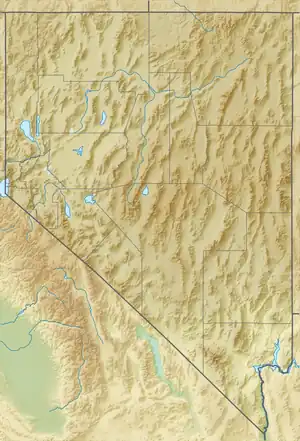
Slide Mountain is a 9,702-foot (2,957 m) peak in the Carson Range near Reno, in Washoe County, Nevada. From the summit of Slide Mountain, Lake Tahoe, Washoe Lake, Carson Valley, and the city of Reno can be viewed.
| Slide Mountain | |
|---|---|
.jpg.webp) | |
| Highest point | |
| Elevation | 9,702 ft (2,957 m) NAVD 88[1] |
| Prominence | 778 ft (237 m)[1] |
| Coordinates | 39°18′46″N 119°53′04″W[2] |
| Geography | |
 Slide Mountain | |
| Location | Washoe County, Nevada, U.S. |
| Parent range | Carson Range |
| Topo map | USGS Mount Rose |
History
Slide Mountain is named after the repeated large landslides that occur high on the mountain's south east side. The slide areas are devoid of trees and vegetation and are covered in granite rock and decomposed granite sand. This gives the barren slopes a whitish color, and the distinctive slide zones are plainly visible from points to the southeast of the mountain in Washoe Valley.
The most recent large slide occurred on May 30, 1983. The slide ran immediately into Price Lake in a small valley halfway down the mountain. The resulting slurry of granite sand, granite rock, and forest debris flowed freely down the canyon below Price Lake, and ran out on the flat floor of Washoe Valley. The debris flow severed the older US 395 highway, and partially covered the newer US 395 freeway. The slide destroyed several homes, killed one person, and injured several others. The volume of water flushed out of Price Lake was estimated to be 7 million gallons. The debris flow in the canyon was measured as 30 feet high at the bottom of the canyon, and the rock fall volume was estimated to be 1.4 million cubic yards.[3][4]
Slide Mountain dominates the Reno skyline, standing 5,000 feet (1,500 m) above the city just to the south of its larger neighbor Mount Rose. Several ski trails and a maintenance road lead to the summit, making the hike to the top an easy one, especially from the Mount Rose Summit Campground located on State Route 431 at the Northwest base. The "Mount Rose Ski Tahoe" resort is located on Slide mountain. This leads some to believe that the mountain itself is named Mount Rose, but Mount Rose is actually approximately 1,000 feet (300 m) higher and several miles to the northwest.
Many communications towers adorn the summit, providing television, radio, emergency responder and amateur communications service to the Reno, Carson City and Lake Tahoe areas.
Climate
| Climate data for Slide Mountain (NV) 39.3092 N, 119.8841 W, Elevation: 9,455 ft (2,882 m) (1991–2020 normals) | |||||||||||||
|---|---|---|---|---|---|---|---|---|---|---|---|---|---|
| Month | Jan | Feb | Mar | Apr | May | Jun | Jul | Aug | Sep | Oct | Nov | Dec | Year |
| Average high °F (°C) | 32.9 (0.5) |
32.6 (0.3) |
35.6 (2.0) |
39.6 (4.2) |
47.9 (8.8) |
57.9 (14.4) |
68.0 (20.0) |
67.2 (19.6) |
60.6 (15.9) |
49.8 (9.9) |
38.6 (3.7) |
31.7 (−0.2) |
46.9 (8.3) |
| Daily mean °F (°C) | 25.9 (−3.4) |
25.0 (−3.9) |
27.3 (−2.6) |
30.4 (−0.9) |
38.7 (3.7) |
48.0 (8.9) |
57.9 (14.4) |
57.1 (13.9) |
50.5 (10.3) |
40.8 (4.9) |
31.3 (−0.4) |
25.1 (−3.8) |
38.2 (3.4) |
| Average low °F (°C) | 18.9 (−7.3) |
17.5 (−8.1) |
18.9 (−7.3) |
21.2 (−6.0) |
29.5 (−1.4) |
38.1 (3.4) |
47.8 (8.8) |
46.9 (8.3) |
40.5 (4.7) |
31.7 (−0.2) |
24.0 (−4.4) |
18.4 (−7.6) |
29.4 (−1.4) |
| Average precipitation inches (mm) | 8.68 (220) |
7.99 (203) |
7.18 (182) |
3.50 (89) |
2.32 (59) |
0.93 (24) |
0.32 (8.1) |
0.32 (8.1) |
0.57 (14) |
2.15 (55) |
4.40 (112) |
9.48 (241) |
47.84 (1,215.2) |
| Source: PRISM Climate Group[5] | |||||||||||||
.jpg.webp)
References
- "Slide Mountain, Nevada". Peakbagger.com. Retrieved 2014-01-20.
- "Slide Mountain". Geographic Names Information System. United States Geological Survey, United States Department of the Interior. Retrieved 2021-11-22.
- "Photos: Slide Mountain disaster, Memorial Day 1983, Reno Gazette Journal". Retrieved 2018-05-14.
- "One killed as a Nevada mud slide floods lakes and destroys homes, New York Times". Retrieved 2018-05-14.
- "PRISM Climate Group, Oregon State University". PRISM Climate Group, Oregon State University. Retrieved October 8, 2023.
To find the table data on the PRISM website, start by clicking Coordinates (under Location); copy Latitude and Longitude figures from top of table; click Zoom to location; click Precipitation, Minimum temp, Mean temp, Maximum temp; click 30-year normals, 1991-2020; click 800m; click Retrieve Time Series button.