Solar cycle 25
Solar cycle 25 is the current solar cycle, the 25th since 1755, when extensive recording of solar sunspot activity began. It began in December 2019 with a minimum smoothed sunspot number of 1.8.[2] It is expected to continue until about 2030.[3][4]
| Solar cycle 25 | |
|---|---|
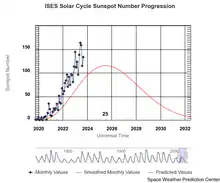 ISES Solar Cycle 25 Sunspot Number Progression and Predictions as of September 2023 | |
| Sunspot data | |
| Start date | December 2019 |
| Max count | 121 (smoothed) |
| Max count month | March 2023 (progressive)[1] |
| Min count | 1.8 |
| Cycle chronology | |
| Previous cycle | Solar cycle 24 (12/2008-12/2019) |
Predictions
Widely varying predictions regarding the strength of cycle 25 ranged from very weak with suggestions of slow slide in to a Maunder minimum like state[5][6] to a weak cycle similar to previous cycle 24[7] and even a strong cycle.[8][9][10] Upton and Hathaway predicted that the weakness of cycle 25 would make it part of the Modern Gleissberg Minimum.[5]
The Solar Cycle 25 Prediction Panel predicted in December 2019[11] that solar cycle 25 will be similar to solar cycle 24, with the preceding solar cycle minimum in April 2020 (± 6 months), and the number of sunspots reaching a (smoothed) maximum of 115 in July 2025 (± 8 months). This prediction is in line with the current general agreement in the scientific literature, which holds that solar cycle 25 will be weaker than average (i.e. weaker than during the exceptionally strong Modern Maximum).[7] However, observations from 2020 to 2022, the first three years of the cycle, significantly exceed predicted values.[12]
| Source | Date | Cycle max | Cycle start | Cycle end |
|---|---|---|---|---|
| Thompson, M.J. et al.[4] | August 2014 | Q4 2019 | ||
| Zharkova, V. et al 2014, 2015.[13] (Northumbria U.) | October 2014 | 65 (80% of cycle 24) | ||
| Upton, L.A. and Hathaway, D.H.[5] (Solar Observatories Group, Stanford University) | December 2018 | 78 (95% of cycle 24) | Late 2020 – Early 2021 | |
| Xu, J.C. et al.[8] (Chinese Academy of Sciences) | August 2018 | 168.5 ± 16.3 (2024) | October 2020 | |
| Bhowmik, P. and Nandy, D.[7] (IISER Kolkata) | December 2018 | 124 ± 15 (2023–2025) | 2020 | after 2031 |
| Ozguc, A. et al.[9] (Harvard U-ty) | December 2018 | 154 ± 12 (2023.2±1.1) | ||
| NOAA / SSRC[14] | April 2019 | 117 ± 23 (2023–2026) | mid-2019 – late 2020 | |
| NASA[15] | June 2019 | 70 ± 29 (30–50% lower than Cycle 24 (2025)) | 2020 | |
| NOAA / SSRC (update)[16] | December 2019 | 115 ± 10 (July 2025) | April 2020 (± 6 months) | |
| Mcintosh et al..[17][18] | June 2020 | 229 ± 25 | ||
| Mcintosh et al.[17][18] | December 2020 | 190 ± 20 | ||
| National Center for Atmospheric Research[19] | December 2020 | 233 | ||
| (Actual) | present | >121 | December 2019 | - |
Early signs
As of April 2018, the Sun showed signs of a reverse magnetic polarity sunspot appearing and beginning this solar cycle.[20] It is typical during the transition from one cycle to the next to experience a period where sunspots of both polarities exist (during the solar minimum). The polarward reversed polarity sunspots suggested that a transition to cycle 25 was in process.[21] The first cycle 25 sunspot may have appeared in early April 2018[22][23] or even December 2016.[21]
In November 2019, two reversed polarity sunspots appeared, possibly signaling the onset of cycle 25.[24][25]
Nandy et al., analyzed the polarity orientation of bipolar magnetic regions observed in December 2019 and concluded that magnetic regions with the underlying orientation of solar cycle 25 toroidal field component were brewing in the solar convection zone, representing early signs of the new cycle.[26]
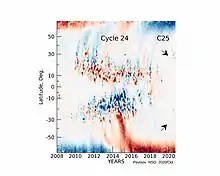
Supersynoptic (time vs. solar latitude) map of the radial component of the solar magnetic field for cycles 24-25 based on observations from the Global Oscillations Network Group (GONG) shows magnetic activity of cycle 25 beginning November 2019 at about 30 degree latitudes in both solar hemispheres.[27] A more recent supersynoptic map is available.[28]
The following table gives the number of days so far in cycle 25 against the number up to the same point in cycle 24, and also up to the end of 2012 in cycle 24, which have passed various thresholds for the numbers of sunspots.
| Counts | SC 24 to Dec 31 2012 |
SC 24 to Sep 22 2012 |
SC 25 to Sep 22 2023 |
|---|---|---|---|
| ≥75 sunspots | 399 | 353 | 494 |
| ≥100 | 241 | 223 | 334 |
| ≥125 | 116 | 109 | 207 |
| ≥150 | 39 | 39 | 99 |
| ≥175 | 6 | 6 | 41 |
| ≥200 | 0 | 0 | 13 |
| ≥225 | 0 | 0 | 2 |
As at Sep 22 2023, solar cycle 25 is averaging 25% more spots per day than solar cycle 24 at the same point in the cycle (Sep 22 2012).
Year 4 of solar cycle 25 (Dec 1 2022 to Sep 22 2023) is averaging 45% more spots per day than the corresponding period in solar cycle 24.
Events
10
20
30
40
2019
2020
2021
2022
2023
2024
2025
2026
2027
2028
2029
2030
|
| Class | Year | Date | Sunspot region | Radio B. | SR Storm | CME | GM Storm |
|---|---|---|---|---|---|---|---|
| X2.28 | 2023 | Feb 17 | 3229 | R3 | - | Yes | - |
| X2.25 | 2022 | Apr 20 | 2992 | R3 | - | Yes | - |
| X2.07 | 2023 | Mar 3 | 3234 | R3 | - | Yes | - |
| X1.98 | 2023 | Jan 9 | 3184 | R3 | - | No | - |
| X1.63 | 2023 | Aug 5 | 3386 | R3 | S1 | Yes | - |
| X1.59 | 2021 | Jul 3 | 2838 | R3 | - | Yes | - |
| X1.51 | 2022 | May 10 | 3006 | R3 | - | No | - |
| X1.51 | 2023 | Aug 7 | 3386 | R3 | S1 | Yes | - |
| X1.38 | 2022 | Mar 30 | 2975 | R3 | S1 | Yes | G1 |
| X1.27 | 2023 | Mar 29 | 3256 | R3 | - | Yes | - |
| X1.22 | 2023 | Jan 6 | 3182 | R3 | - | No | - |
| X1.17 | 2022 | Apr 17 | 2994 | R3 | - | Yes | - |
| X1.16 | 2023 | Feb 11 | 3217 | R3 | - | No | - |
| X1.13 | 2022 | Apr 30 | 2994 | R3 | - | Yes | - |
| X1.13 | 2022 | May 3 | 3006 | R3 | - | No | - |
| X1.11 | 2023 | Jun 20 | 3341 | R3 | - | Yes | - |
| X1.08 | 2023 | Jul 2 | 3354 | R3 | - | No | - |
| X1.06 | 2022 | Oct 2 | 3110 | R3 | - | Yes | - |
| X1.06 | 2023 | Jan 10 | 3186 | R3 | - | Yes | - |
| X1.0 | 2021 | Oct 28 | 2887 | R3 | S1 | Yes | - |
| M9.67 | 2022 | Mar 31 | 2975 | R2 | - | Yes | - |
| M9.66 | 2022 | Apr 21 | 2993 | R2 | - | Yes | - |
| M9.62 | 2023 | May 16 | 3310 | R2 | - | No | - |
| M8.96 | 2023 | May 20 | 3311 | R2 | - | No | - |
| M8.77 | 2022 | Oct 2 | 3110 | R2 | - | Yes | G1 |
| M8.72 | 2023 | Sep 21 | 3435 | R2 | - | Yes | ? |
| M8.67 | 2022 | Aug 29 | 3088 | R2 | - | No | - |
| M8.62 | 2023 | Feb 28 | 3234 | R2 | - | Yes | - |
| M8.23 | 2023 | Sep 20 | 3435 | R2 | - | No | - |
| M7.92 | 2022 | Sep 16 | 3098 | R2 | - | No | - |
| M7.29 | 2022 | Apr 20 | 2992 | R2 | - | Yes | - |
| M7.27 | 2023 | May 3 | 3293 | R2 | - | No | - |
| M7.24 | 2022 | Aug 26 | 3089 | R2 | - | Yes | - |
| M7.12 | 2023 | May 1 | 3288 | R2 | - | No | - |
| M6.97 | 2023 | Jul 12 | 3372 | R2 | - | No | - |
| M6.83 | 2023 | Jul 11 | 3368 | R2 | - | No | - |
| M6.73 | 2022 | Aug 28 | 3088 | R2 | - | Yes | - |
| M6.57 | 2023 | May 9 | 3296 | R2 | - | Yes | - |
| M6.5 | 2023 | May 20 | 3311 | R2 | - | No | - |
| M6.39 | 2023 | Feb 7 | 3213 | R2 | - | No | - |
| M6.36 | 2022 | Dec 14 | 3165 | R2 | - | No | - |
| M6.35 | 2023 | Feb 25 | 3229 | R2 | S1 | Yes | G3 |
| M6.2 | 2022 | Sep 16 | 3098 | R2 | - | No | - |
| M6.03 | 2023 | Jan 15 | 3191 | R2 | - | Yes | - |
| M6.01 | 2023 | Sep 3 | 3413 | R2 | - | Yes | ? |
| M5.86 | 2022 | Oct 1 | 3110 | R2 | - | Yes | G1 |
| M5.86 | 2023 | Jul 11 | 3372 | R2 | - | No | - |
| M5.8 | 2023 | Mar 6 | 3243 | R2 | - | Yes | - |
| M5.76 | 2022 | May 4 | 3004 | R2 | - | No | - |
| M5.74 | 2022 | Dec 15 | 3165 | R2 | - | No | - |
| M5.72 | 2023 | Jul 17 | 3363 | R2 | S2 | Yes | - |
| M5.68 | 2023 | May 20 | 3311 | R2 | - | No | - |
| M5.67 | 2023 | Jan 11 | 3184 | R2 | - | Yes | - |
| M5.54 | 2022 | May 19 | 3014 | R2 | - | No | - |
| M5.51 | 2023 | Aug 6 | 3386 | R2 | - | Yes | - |
| M5.5 | 2022 | Jan 20 | 2929 | R2 | S1 | Yes | - |
| M5.41 | 2023 | Mar 30 | 3256 | R2 | S0 | Yes | - |
| M5.39 | 2022 | Aug 26 | 3089 | R2 | - | No | - |
| M5.39 | 2023 | May 19 | 3311 | R2 | - | No | - |
| M5.32 | 2022 | May 4 | 3006 | R2 | - | No | - |
| M5.27 | 2022 | Mar 4 | 3234 | R2 | - | Yes | - |
| M5.25 | 2022 | Nov 7 | 3141 | R2 | - | No | - |
| M5.2 | 2023 | May 20 | 3311 | R2 | - | No | - |
| M5.15 | 2023 | Jan 10 | 3186 | R2 | S0 | Yes | - |
| M5.09 | 2023 | Feb 21 | 3234 | R2 | - | Yes | - |
| M5.08 | 2022 | Aug 16 | 3078 | R2 | - | No | - |
| M5.04 | 2023 | Mar 5 | 3243 | R2 | - | No | - |
| M5.02 | 2023 | May 9 | 3296 | R2 | - | No | - |
100
200
300
400
2019
2020
2021
2022
2023
2024
2025
2026
2027
2028
2029
2030
|
2020
10
20
30
40
50
60
Jan
Feb
Mar
Apr
May
Jun
Jul
Aug
Sep
Oct
Nov
Dec
|
10
20
30
40
Jan
Feb
Mar
Apr
May
Jun
Jul
Aug
Sep
Oct
Nov
Dec
|
On 29 May, the first C-class solar flares of Solar Cycle 25 took place, as well as the first M-class flare. Solar activity continued to increase in the following months, especially abruptly in October, with flares taking place on a near-daily basis by November. On 29 November, an M4.4 flare, the strongest of the cycle to date, took place, possibly indicating the solar cycle would be more active than initially thought.[31]
On 8 December, a small coronal mass ejection was found heading directly towards Earth shortly after a strong C-class solar flare, hitting the planet on 9-10 December and causing bright aurorae at high latitudes.[32][33]
2021
50
100
150
200
Jan
Feb
Mar
Apr
May
Jun
Jul
Aug
Sep
Oct
Nov
Dec
|
10
20
30
40
Jan
Feb
Mar
Apr
May
Jun
Jul
Aug
Sep
Oct
Nov
Dec
|
The first X-class solar flare of the cycle took place on 3 July, peaking at X1.59.[35]
On 22 July, a total of six different active regions were seen on the solar disk for the first time since 6 September 2017.[36]
On 9 October, a M1.6 class solar flare erupted sending a coronal mass ejection that hit earth on 12 October triggering a (moderate) G2 geomagnetic storm.[37]
The second X-class flare of the solar cycle erupted on 28 October, producing a CME and a S1 solar radiation storm.[38] Reports initially predicted that the CME could graze Earth,[38] however geomagnetic storms on 30-31 October only reached a moderate Kp index of 4.[39]
On 3 and 4 November, the Kp index reached 8-, equivalent to a G4 geomagnetic storm.[40] This was the most intense geomagnetic storm to hit Earth since September 2017.
2022
100
200
300
400
Jan
Feb
Mar
Apr
May
Jun
Jul
Aug
Sep
Oct
Nov
Dec
|
10
20
30
40
Jan
Feb
Mar
Apr
May
Jun
Jul
Aug
Sep
Oct
Nov
Dec
|
In late March, sunspot region 2975 released X1.3 and M9.6 flares, the former causing a G1 geomagnetic storm on 31 March despite being near the solar limb.[41] The region rotated out of view of Earth on 5 April, but helioseismic measurements on April 8 showed it still active on the far side of the Sun.[42] On 12 April, a Coronal Mass Ejection on the far side likely erupted from the region,[43] with helioseismic measurements showing the region to have intensified since crossing over the limb. As the region began rotating into view from Earth, a possibly X-class flare occurred on 15 April.[44]
After rotating to the visible hemisphere of the Sun, the regions of the sunspot complex were designated 2993 through 2996. On 17 April, sunspot group 2994 released an X1.2 flare.[45][46] However, the complex's activity subsided slightly in the next few days.[47] While crossing the solar limb, sunspot region 2992 emitted M7.3 and X2.2 flares, the latter being the strongest of the cycle yet.[47]
See also
References
- "Sunspot Number and Long-term Solar Observations: on-line Sunspot Number catalogue". SILSO, World Data Center. Royal Observatory of Belgium. Archived from the original on 5 April 2023.
- National Weather Service. "Hello Solar Cycle 25". Archived from the original on 18 March 2021. Retrieved 15 September 2020.
- Odenwald, Sten (2 September 2016). "Waiting for the next sunspot cycle: 2019-2030". The Huffington Post. Archived from the original on 12 December 2018. Retrieved 22 November 2017.
- McIntosh, Scott W.; Wang, Xin; Leamon, Robert J.; Davey, Alisdair R.; Howe, Rachel; Krista, Larisza D.; Malanushenko, Anna V.; Markel, Robert S.; Cirtain, Jonathan W.; Gurman, Joseph B.; Pesnell, William D.; Thompson, Michael J. (8 August 2014). "Deciphering Solar magnetic activity: On the relationship between the sunspot cycle and the evolution of small magnetic features". The Astrophysical Journal. 792 (1): 12. arXiv:1403.3071. Bibcode:2014ApJ...792...12M. doi:10.1088/0004-637X/792/1/12. S2CID 118418019.
- Upton, Lisa A.; Hathaway, David H. (28 August 2018). "An updated solar cycle 25 prediction with AFT: The modern minimum". Geophysical Research Letters. 45 (16): 8091–8095. arXiv:1808.04868. Bibcode:2018GeoRL..45.8091U. doi:10.1029/2018GL078387. S2CID 118913702.
- Kitiashvili et al.
- Bhowmik, Prantika; Nandy, Dibyendu (6 December 2018). "Prediction of the strength and timing of sunspot cycle 25 reveal decadal-scale space environmental conditions". Nature Communications. 9 (1): 5209. arXiv:1909.04537. Bibcode:2018NatCo...9.5209B. doi:10.1038/s41467-018-07690-0. PMC 6283837. PMID 30523260.
- Li, F.Y.; Kong, D.F.; Xie, J.L.; Xiang, N.B.; Xu, J.C. (December 2018). "Solar cycle characteristics and their application in the prediction of cycle 25". Journal of Atmospheric and Solar-Terrestrial Physics. 181: 110–115. Bibcode:2018JASTP.181..110L. doi:10.1016/j.jastp.2018.10.014. S2CID 125789139.
- Sarp, V; Kilcik, A; Yurchyshyn, V; Rozelot, J P; Ozguc, A (December 2018). "Prediction of solar cycle 25: a non-linear approach". Monthly Notices of the Royal Astronomical Society. 481 (3): 2981–2985. Bibcode:2018MNRAS.481.2981S. doi:10.1093/mnras/sty2470.
- McIntosh, Scott W.; Chapman, Sandra C.; Leamon, Robert J.; Egeland, Ricky; Watkins, Nicholas W. (26 June 2020). "Overlapping Magnetic Activity Cycles and the Sunspot Number: Forecasting Sunspot Cycle 25 Amplitude". Solar Physics. 295 (12): 163. arXiv:2006.15263. Bibcode:2020SoPh..295..163M. doi:10.1007/s11207-020-01723-y. S2CID 220250556.
- "Solar Cycle 25 Forecast Update | NOAA / NWS Space Weather Prediction Center". Archived from the original on 21 March 2021. Retrieved 9 January 2020.
- "Solar Cycle 25 Continues to Strengthen Rapidly". climateimpactcompany.com. 10 July 2022. Archived from the original on 21 December 2022. Retrieved 21 December 2022.
- Shepherd, Simon J.; Zharkov, Sergei I.; Zharkova, Valentina V. (13 October 2014). "Prediction of solar activity from solar background magnetic field variations in cycles 21–23". The Astrophysical Journal. 795 (1): 46. Bibcode:2014ApJ...795...46S. doi:10.1088/0004-637X/795/1/46. hdl:10454/10790. S2CID 29947523.
- Kunches, Joe (11 April 2019). "Scientists predict a new solar cycle is about to begin and that it might be stronger than the last one". Washington Post. Archived from the original on 3 February 2021. Retrieved 12 April 2019.
- "Solar activity forecast for next decade favorable for exploration". NASA Ames. 12 June 2019. Archived from the original on 6 April 2021. Retrieved 16 September 2019.
- "SOLAR CYCLE 25 FORECAST UPDATE". SPACE WEATHER PREDICTION CENTER - NATIONAL OCEANIC AND ATMOSPHERIC ADMINISTRATION. 9 December 2019. Archived from the original on 21 March 2021. Retrieved 9 January 2020.
- McIntosh, Scott W.; Chapman, Sandra C.; Leamon, Robert J.; Egeland, Ricky; Watkins, Nicholas W. (December 2020). "Overlapping Magnetic Activity Cycles and the Sunspot Number: Forecasting Sunspot Cycle 25 Amplitude". Solar Physics. 295 (12): 163. arXiv:2006.15263. Bibcode:2020SoPh..295..163M. doi:10.1007/s11207-020-01723-y. S2CID 220250556.
- "Solar Cycle 25: The Overachiever". Space Weather Live. Archived from the original on 11 April 2022. Retrieved 12 April 2022.
- Cappucci, Matthew (19 December 2020). "Maverick astrophysicist calls for unusually intense solar cycle, straying from consensus view". The Washington Post. Archived from the original on 9 January 2021. Retrieved 7 January 2021.
- "Coronal hole faces Earth". Space Weather Live. Archived from the original on 21 September 2018. Retrieved 24 April 2018.
- Phillips, Tony (20 November 2018). "A sunspot from the next solar cycle". SpaceWeather.com. Archived from the original on 1 December 2020. Retrieved 13 December 2018.
- "Cycle 25 observations in SDO HMI imagery". Archived from the original on 10 April 2020. Retrieved 4 May 2018.
- Hudson, Hugh (10 April 2018). "A sunspot from cycle 25 for sure". RHESSI project. Archived from the original on 19 September 2020. Retrieved 22 November 2018.
- "Do we see a dawn of solar cycle 25?". National Solar Observatory. 25 November 2019. Archived from the original on 26 November 2020. Retrieved 26 November 2019.
- "Spaceweather.com Time Machine". spaceweather.com. Archived from the original on 20 September 2020. Retrieved 26 December 2019.
- Nandy, Dibyendu; Bhatnagar, Aditi; Pal, Sanchita (2 March 2020). "Sunspot Cycle 25 is Brewing: Early Signs Herald its Onset". Research Notes of the AAS. 4 (2): 30. Bibcode:2020RNAAS...4...30N. doi:10.3847/2515-5172/ab79a1. S2CID 216379844.
- Pevtsov, Alexei A.; Bertello, Luca; Nagovitsyn, Yury A.; Tlatov, Andrey G.; Pipin, Valery V. (22 January 2021). "Long-term studies of photospheric magnetic fields on the Sun". J. Space Weather Space Clim. 11: 4. Bibcode:2021JSWSC..11....4P. doi:10.1051/swsc/2020069.
- Pevtsov, Alexei (13 March 2021). "Time vs. solar latitude diagram of the radial component of the solar magnetic field (supersynoptic map of "butterfly" diagram". Archived from the original on 17 February 2022. Retrieved 13 March 2021.
- "Aurora and solar activity archive". spaceweatherlive.com. Archived from the original on 1 February 2022. Retrieved 1 February 2022.
- "Aurora and solar activity archive". spaceweatherlive.com. Archived from the original on 17 February 2022. Retrieved 10 December 2020.
- "M4.44 solar flare". spaceweatherlive.com. 29 November 2020. Archived from the original on 30 November 2020. Retrieved 10 December 2020.
- "Earth-directed coronal mass ejection". spaceweatherlive.com. Archived from the original on 13 December 2020. Retrieved 10 December 2020.
- Van Dam, Derek (9 December 2020). "Sun launches explosion of electromagnetic energy towards Earth: Geomagnetic Storm Watch issued". CNN. CNN. Archived from the original on 20 March 2021. Retrieved 10 December 2020.
- "Aurora and solar activity archive". spaceweatherlive.com. Archived from the original on 17 February 2022. Retrieved 23 February 2021.
- "First X-class solar flare of Solar Cycle 25". Space Weather Live. 3 July 2021. Archived from the original on 3 July 2021. Retrieved 4 July 2021.
- "Solar max might come a bit early". Space weather. Archived from the original on 5 August 2021. Retrieved 5 August 2021.
- "Geomagnetic Storm: Solar Eruption Arrives at Earth". SciTechDaily. 16 October 2021. Archived from the original on 17 October 2021. Retrieved 17 October 2021.
- "Sun Unleashes Major X-class Solar Flare". Space. 28 October 2021. Archived from the original on 9 November 2021. Retrieved 28 October 2021.
- "The aurora and solar activity archive - October 2021". space weather live. Archived from the original on 13 November 2021. Retrieved 13 November 2021.
- "Viewing archive of Thursday, 4 November 2021". space weather live. Archived from the original on 13 November 2021. Retrieved 13 November 2021.
- "X1.3 solar flare". Spaceweatherlive.com. Archived from the original on 21 April 2022. Retrieved 21 April 2022.
- "What's happening on farside of the Sun?". spaceweather.com. Archived from the original on 21 April 2022. Retrieved 21 April 2022.
- "Farside explosion targets MErcury". spaceweather.com. Archived from the original on 14 April 2022. Retrieved 21 April 2022.
- "An active sunspot is approaching". spaceweather.com. Archived from the original on 16 April 2022. Retrieved 21 April 2022.
- "X-class solar flare (updated)". spaceweather.com. Archived from the original on 19 April 2022. Retrieved 21 April 2022.
- "X1.1 solar flare". spaceweatherlive.com. Archived from the original on 18 April 2022. Retrieved 21 April 2022.
- "M7.3 and X2.2 solar flares". spaceweatherlive.com. Archived from the original on 21 April 2022. Retrieved 21 April 2022.
- "Aurora and solar activity archive". spaceweatherlive.com. Archived from the original on 24 April 2023. Retrieved 1 February 2023.
External links
- "Solar Cycle Prediction". NASA Marshall Space Flight Center.
- "Solar Cycle Progression". NOAA Space Weather Prediction Center.
- "Solar Cycle Prediction". Solar Cycle Science.
| 18th century |
|  |
|---|---|---|
| 19th century |
| |
| 20th century |
| |
| 21st century |
| |