South Holland and The Deepings (UK Parliament constituency)
South Holland and The Deepings is a constituency in Lincolnshire represented in the House of Commons of the UK Parliament since its 1997 creation by John Hayes, a Conservative.
| South Holland and The Deepings | |
|---|---|
| County constituency for the House of Commons | |
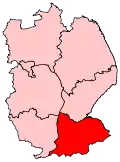
 Boundary of South Holland and The Deepings in Lincolnshire | |
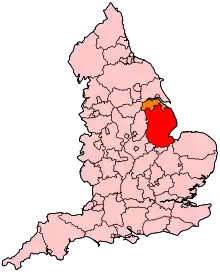
 Location of Lincolnshire within England | |
| County | Lincolnshire |
| Electorate | 76,939 (December 2010)[1] |
| Major settlements | Spalding, Holbeach, Long Sutton and The Deepings |
| Current constituency | |
| Created | 1997 |
| Member of Parliament | John Hayes (Conservative) |
| Seats | One |
| Created from | Holland with Boston, Stamford and Spalding |
At the 2017 general election, the constituency recorded a higher Conservative share of the vote than any constituency since 1970, with 69.9% of voters backing the party. South Holland also delivered the second-highest "Leave" vote in the 2016 referendum on the UK's membership of the European Union (EU). 73.6% of voters endorsed the UK's withdrawal from the EU, second only to neighbouring Boston.[2] At the 2019 general election, the Conservative majority was 62.7%, the highest of any Conservative in any constituency in any general election since Kensington South in 1955. Hayes took 75.9% of the vote, the third highest for the Conservatives only after Castle Point in Essex and Boston and Skegness.
Constituency profile
This is a largely rural seat with agriculture, bulb growing and food processing as the main economic activities.[3] Incomes and house prices are below UK averages.[4]
Boundaries
1997–2010: The District of South Holland, with the wards of Deeping St James, Market Deeping, West Deeping and Truesdale, which are all in the District of South Kesteven.
2010–present: The District of South Holland, with Deeping St James, Market Deeping and West Deeping.
The constituency was created in 1997 from parts of the former seats of Holland with Boston and Stamford and Spalding. It covers the area around Spalding. It roughly corresponds to the local government District of South Holland, but with Market Deeping, Deeping St James and West Deeping added.
In minor boundary changes that were put in place for the 2010 general election, parts of the two civil parishes of Baston and Langtoft, forming much of the Truesdale ward, were moved to the neighbouring constituency of Grantham and Stamford. This made Market Deeping and Deeping St James the only South Kesteven parishes to stay in the constituency, the remainder being in South Holland District.
History
The last non-Conservative member for the predecessor main seat was Sir Herbert Butcher (served 1937–1966) who for much of that time was in the National Liberal Party set up in 1931.
The member from 1966 until 1997 was Richard Body for the main contributor seat (in later years as MP, knighted), who had previously been an MP during the Eden government and the start of the Macmillan government for Billericay, and later wrote assertive books on agriculture and on the Common Agricultural Policy.
In the 2017 general election, the seat returned the highest vote share for the Conservatives nationally at 69.9%.[5] In the 2019 general election, it was an extremely safe Conservative seat. It had the largest percentage majority, third-largest absolute majority, and third-largest Conservative vote share of any seat held by the party; nationally the seat had the eleventh-largest percentage majority of any constituency.[6]
Members of Parliament
| Election | Member[7] | Party | |
|---|---|---|---|
| 1997 | John Hayes | Conservative | |
Elections
Elections in the 2010s
| Party | Candidate | Votes | % | ±% | |
|---|---|---|---|---|---|
| Conservative | John Hayes | 37,338 | 75.9 | +6.0 | |
| Labour | Mark Popple | 6,500 | 13.2 | −7.2 | |
| Liberal Democrats | Davina Kirby | 3,225 | 6.6 | +3.8 | |
| Green | Martin Blake | 1,613 | 3.3 | +1.5 | |
| Independent | Rick Stringer | 503 | 1.0 | +0.3 | |
| Majority | 30,838 | 62.7 | +13.2 | ||
| Turnout | 49,179 | 64.7 | -1.1 | ||
| Conservative hold | Swing | +6.6 | |||
| Party | Candidate | Votes | % | ±% | |
|---|---|---|---|---|---|
| Conservative | John Hayes | 35,179 | 69.9 | +10.3 | |
| Labour | Voyteck Kowalewski | 10,282 | 20.4 | +8.0 | |
| UKIP | Nicola Smith | 2,185 | 4.3 | -17.5 | |
| Liberal Democrats | Julia Cambridge | 1,433 | 2.8 | -0.2 | |
| Green | Daniel Wilshire | 894 | 1.8 | -1.4 | |
| Independent | Rick Stringer | 342 | 0.7 | New | |
| Majority | 24,897 | 49.5 | +11.7 | ||
| Turnout | 50,315 | 65.8 | -1.9 | ||
| Conservative hold | Swing | +1.2 | |||
| Party | Candidate | Votes | % | ±% | |
|---|---|---|---|---|---|
| Conservative | John Hayes | 29,303 | 59.6 | +0.5 | |
| UKIP | David Parsons | 10,736 | 21.8 | +15.3 | |
| Labour | Matthew Mahabadi | 6,122 | 12.4 | -1.6 | |
| Green | Daniel Wilshire | 1,580 | 3.2 | +1.8 | |
| Liberal Democrats | George Smid | 1,466 | 3.0 | -12.5 | |
| Majority | 18,567 | 37.8 | -5.8 | ||
| Turnout | 49,207 | 63.9 | +1.9 | ||
| Conservative hold | Swing | -7.9 | |||
| Party | Candidate | Votes | % | ±% | |
|---|---|---|---|---|---|
| Conservative | John Hayes | 29,639 | 59.1 | +2.1 | |
| Liberal Democrats | Jennifer Conroy | 7,759 | 15.5 | +2.6 | |
| Labour | Gareth Gould | 7,024 | 14.0 | −10.5 | |
| UKIP | Richard Fairman | 3,246 | 6.5 | +2.5 | |
| BNP | Roy Harban | 1,796 | 3.6 | New | |
| Green | Ashley Baxter | 724 | 1.4 | New | |
| Majority | 21,880 | 43.6 | +11.1 | ||
| Turnout | 50,188 | 65.8 | +4.3 | ||
| Conservative hold | Swing | -0.2 | |||
Elections in the 2000s
| Party | Candidate | Votes | % | ±% | |
|---|---|---|---|---|---|
| Conservative | John Hayes | 27,544 | 57.1 | +1.7 | |
| Labour | Linda Woodings | 11,764 | 24.4 | −7.0 | |
| Liberal Democrats | Steve Jarvis | 6,244 | 12.9 | +2.6 | |
| UKIP | Jamie Corney | 1,950 | 4.0 | +1.1 | |
| Independent | Paul Poll | 747 | 1.5 | New | |
| Majority | 15,780 | 32.7 | +8.7 | ||
| Turnout | 48,249 | 60.6 | −1.5 | ||
| Conservative hold | Swing | +4.4 | |||
| Party | Candidate | Votes | % | ±% | |
|---|---|---|---|---|---|
| Conservative | John Hayes | 25,611 | 55.4 | +6.1 | |
| Labour | Graham Walker | 14,512 | 31.4 | -1.9 | |
| Liberal Democrats | Grace Hill | 4,761 | 10.3 | -5.3 | |
| UKIP | Malcolm Charlesworth | 1,318 | 2.9 | New | |
| Majority | 11,099 | 24.0 | +8.0 | ||
| Turnout | 46,202 | 62.1 | -9.9 | ||
| Conservative hold | Swing | ||||
Elections in the 1990s
| Party | Candidate | Votes | % | ±% | |
|---|---|---|---|---|---|
| Conservative | John Hayes | 24,691 | 49.3 | ||
| Labour | John Lewis | 16,700 | 33.3 | ||
| Liberal Democrats | Peter Millen | 7,836 | 15.6 | ||
| Non-party Conservative | Guy Erwood | 902 | 1.8 | ||
| Majority | 7,991 | 16.0 | |||
| Turnout | 50,129 | 72.0 | |||
| Conservative win (new seat) | |||||
References
- "Electorate Figures - Boundary Commission for England". 2011 Electorate Figures. Boundary Commission for England. 4 March 2011. Archived from the original on 6 November 2010. Retrieved 13 March 2011.
- "EU referendum: The result in maps and charts". BBC News. 24 June 2016. Retrieved 30 August 2018.
- UK Polling Report https://ukpollingreport.co.uk/2015guide/southhollandandthedeepings/
- Electoral Calculus https://www.electoralcalculus.co.uk/fcgi-bin/seatdetails.py?seat=South+Holland+and+The+Deepings
- "GE2017 - Constituency results". Britain Elects (Google Docs). Retrieved 11 June 2017.
- Uberoi, Elise; Baker, Carl; Cracknell, Richard (19 December 2019). General Election 2019: results and analysis (PDF) (Report). House of Commons Library. pp. 10, 73. Archived (PDF) from the original on 26 January 2020. Retrieved 15 February 2020.
- Leigh Rayment's Historical List of MPs – Constituencies beginning with "S" (part 4)
- "South Holland & The Deepings Parliamentary constituency". BBC News. BBC. Retrieved 22 November 2019.
- "South Holland and the Deepings Election Result 2017". BBC News. Retrieved 11 June 2017.
- "Election Data 2015". Electoral Calculus. Archived from the original on 17 October 2015. Retrieved 17 October 2015.
- "South Holland & The Deepings". Election 2015. BBC. Retrieved 8 May 2015.
- "Election Data 2010". Electoral Calculus. Archived from the original on 26 July 2013. Retrieved 17 October 2015.
- "BBC News | Election 2010 | Constituency | South Holland & The Deepings". news.bbc.co.uk.
- "Election Data 2005". Electoral Calculus. Archived from the original on 15 October 2011. Retrieved 18 October 2015.
- "Election Data 2001". Electoral Calculus. Archived from the original on 15 October 2011. Retrieved 18 October 2015.
- "Election Data 1997". Electoral Calculus. Archived from the original on 15 October 2011. Retrieved 18 October 2015.