Southern District (Botswana)
Southern is one of the districts of Botswana. The capital of Southern district is Kanye, home to the Bangwaketse and Barolong in Botswana. The Southern district is home to Botswana's second largest beef farmers where there are large privately owned ranges, and several government run beef ranges which provide agricultural support to the local farmers. Maize and sorghum, Botswana's staple crop, are also raised in the area. Southern district is where the third diamond mine of Botswana was found (the Jwaneng diamond mine), which buoys Botswana's economic state of prosperity. It was the first district to house the capital city before being moved to Gaborone after independence.
Southern | |
|---|---|
 | |
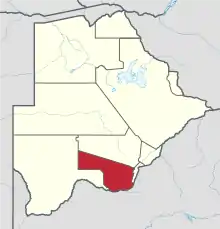
 Location within Botswana | |
| Coordinates: 25°00′S 25°00′E | |
| Country | |
| Capital | Kanye |
| Area | |
| • Total | 28,470 km2 (10,990 sq mi) |
| Population (2022 census)https://www.statsbots.org.bw | |
| • Total | 140,296 |
| • Density | 4.9/km2 (13/sq mi) |
| Time zone | UTC+2 (Central Africa Time) |
| HDI (2017) | 0.700[1] high · 5th |
| Website | [ | footnotes = |
In the south, Southern borders the North West Province of South Africa. Domestically, it borders South-East District in east, Kweneng District in north, Kgalagadi District and south west.
As of 2011, the total population of the district was 197,767 compared to 171,652 in 2001. The growth rate of population during the decade was 1.43. The total number of workers constituted 51,187 with 29,043 males and 22,141 females, with a majority involved in agriculture. The district is administered by a district administration and district council which are responsible for local administration.
Geography
In the south, Southern borders the North West Province of South Africa. Domestically, it borders South-East District in east, Kweneng District in north, Kgalagadi District and south west. Southern District is traversed by the northwesterly line of equal latitude and longitude. Most part of Botswana has tableland slopes sliding from east to west. The region has an average elevation of around 915 m (3,002 ft) above the mean sea level. The vegetation type is Savannah, with tall grasses, bushes and trees. The annual precipitation is around 65 cm (26 in), most of which is received during the summer season from November to May. Most of the rivers in the region are seasonal prone to flash floods.[2] Southern district is where the third diamond mine of Botswana was found (the Jwaneng diamond mine), which drives Botswana's economic state of prosperity.[3]
Administration
Botswana gained independence from the British in 1966 and adapted the colonial administration framework to form its district administration. The policies were modified during 1970–74 to address some of the basic issues.[4] The district is administered by a district administration and district council which are responsible for local administration. The policies for the administration are framed by the Ministry of Local Government. The major activities of the council are Tribal Administration, Remote Area Development and Local Governance. The executive powers of the council are vested on a commissioner appointed by the central government. Technical services wing of the Department of Local Government is responsible for developing roads, infrastructure in villages like water supply, schools and recreational facilities.[5] All the staff of the local administration expect District Administration are selected via Unified Local Government Services (ULGS) and the Ministry of Local Government is responsible for their training, deployment and career development.[6]
The sub-districts of Southern District created as a part of National Development Park of the district are Barolong, Ngwaketse and Ngwaketse West.[7]
In the 2022 Census the following are listed as big villages under each sub-district:[8][9]
| Ngwaketse West Sub-district: 23,248 | Barolong sub-district : 58,384 | Ngwaketse District : 140,296 | ||||||||||||||||||
|---|---|---|---|---|---|---|---|---|---|---|---|---|---|---|---|---|---|---|---|---|
| Village Population | 1981 | 1991 | 2001 | 2011 | 2022 | Village Population | 1981 | 1991 | 2001 | 2011 | 2022 | Village Population | 1981 | 1991 | 2001 | 2011 | 2022 | |||
| Village Mabutsane | 1,220 | Village Pitsane Siding | 4,312 | Village Kanye | 48,028 | |||||||||||||||
| Village Morwamosu | 763 | Village Tlhareseleele | 775 | Village Ranaka | 3,207 | |||||||||||||||
| Village Sekoma | 2,096 | Village Pitsana-Potokwe | 1,012 | Village Lotlhakane West | 2,056 | |||||||||||||||
| Village Khonkhwa | 418 | Village Rakhuna | 1,980 | Village Gasita | 1,188 | |||||||||||||||
| Village Keng | 403 | Village Malokaganyane | 239 | Village Lorolwana | 2,225 | |||||||||||||||
| Village Khakhea | 1,141 | Village Bethel | 430 | Village Kgomokasitwa | 1,669 | |||||||||||||||
| Village Kokong | 655 | Village Dinatshana | 750 | Village Pitseng | 1,526 | |||||||||||||||
| Village Kanaku | 1,141 | Village Ngwatsau | 407 | Village Lekgolobotlo | 1,334 | |||||||||||||||
| Village Mahotshwane | 2,507 | Village Ramatlabama | 1,575 | Village Seherelela | 884 | |||||||||||||||
| Village Itholoke | 1,181 | Village Good Hope | 5,672 | Village Lotlhakane | 6,045 | |||||||||||||||
| Village Kutuku | 847 | Village Mokatako | 837 | Village Sese | 6,798 | |||||||||||||||
| Village Maokane | 1,471 | Village Tswanyaneng | 333 | Village Sesung | 1,006 | |||||||||||||||
| Village Mokhomba | 768 | Village Metlojane | 914 | Village Magotlhwane | 1,751 | |||||||||||||||
| Village Semane | 770 | Village Borobadilepe | 330 | Village Segwagwa | 1,008 | |||||||||||||||
| Village Lefoko | 1,150 | Village Hebron | 890 | Village Manyana | 3,750 | |||||||||||||||
| Village Tsonyane | 695 | Village Logagane | 492 | Village Dipotsana | 113 | |||||||||||||||
| Village Tlhankane | 1,077 | Village Tswagare/Lothoje/Lokalana | 891 | Village Diabo | 261 | |||||||||||||||
| Village Makokwe | 137 | Village Molapowabojang | 8,722 | |||||||||||||||||
| Village Marojane | 266 | Village Ralekgetho | 554 | |||||||||||||||||
| Village Papatlo | 452 | Village Moshaneng | 1,961 | |||||||||||||||||
| Village Phihitshwane | 437 | Village Moshupa | 23,858 | |||||||||||||||||
| Village Molete | 390 | Village Ntlhantlhe | 2,842 | |||||||||||||||||
| Village Ditlharapa | 688 | Village Tshwaane | 193 | |||||||||||||||||
| Village Madingwana | 331 | Village Selokolela | 1,750 | |||||||||||||||||
| Village Kgoro | 818 | Village Mogonye | 1,081 | |||||||||||||||||
| Village Sheep Farm | 273 | Village Betesankwe | 507 | |||||||||||||||||
| Village Mogwalale | 375 | |||||||||||||||||||
| Village Gathwane | 1,099 | |||||||||||||||||||
| Village Digawana | 4,356 | |||||||||||||||||||
| Village Magoriapitse | 1,048 | |||||||||||||||||||
| Village Lejwana | 829 | |||||||||||||||||||
| Village Mogojogojo | 981 | |||||||||||||||||||
| Village Mmathethe | 5,421 | |||||||||||||||||||
| Village Mokgomane | 847 | |||||||||||||||||||
| Village Phitshane Molopo | 1,625 | |||||||||||||||||||
| Village Sedibeng | 744 | |||||||||||||||||||
| Village Musi | 224 | |||||||||||||||||||
| Village Tswaaneng | 771 | |||||||||||||||||||
| Village Gamajalela | 571 | |||||||||||||||||||
| Village Dikhukhung | 303 | |||||||||||||||||||
| Village Leporung | 646 | |||||||||||||||||||
| Village Mmakgori | 749 | |||||||||||||||||||
| Village Mabule | 1,835 | |||||||||||||||||||
| Village Tshidilamolomo | 754 | |||||||||||||||||||
| Village Metlobo | 1,039 | |||||||||||||||||||
| Village Lorwana | 1,721 | |||||||||||||||||||
| Village Kangwe | 142 | |||||||||||||||||||
| Village Sekhutlane | 1,266 | |||||||||||||||||||
- Demographics
| Year | Pop. | ±% |
|---|---|---|
| 1981 | 119,653 | — |
| 1991 | 147,389 | +23.2% |
| 2001 | 171,652 | +16.5% |
| 2011 | 197,767 | +15.2% |
| Sources:[10] | ||
As of 2011, the total population of the district was 197,767 compared to 171,652 in 2001. The growth rate of population during the decade was 1.43. The population in the district was 9.77 per cent of the total population in the country. The sex ratio stood at 93.97 for every 100 males, compared to 92.25 in 2001. The average house hold size was 3.51 in 2011 compared to 4.60 in 2001. There were 5,405 craft and related workers, 1,656 clerks, 11,018 people working in elementary occupation 724 legislators, administrators and managers 2,069 plant and machine operators and assemblers, 1,195 professionals, 3,820 service workers, shop and market sales workers, 3,646 skilled agricultural and related workers, and 2,705 technicians and associated professionals, making the total work force 32,431.[10]
Education and economy
As of 2011, there were a total of 128 schools in the district, with 8.30 per cent private schools. The total number of students in the Council schools was 40,973, while it was 1,602 in private schools. The total number of students enrolled in the district was 42,575: 20,704 girls and 21,871 boys. The total number of qualified teachers was 1,819, 1,370 female and 449 male. There were around 73 temporary teachers, 41 male and 114 female. There were 2 untrained teachers in the district.[11]
As of 2006, 18,751 were involved in Agriculture, 1,832 in Construction, 5,042 in Education, 304 in Electricity & Water, 399 in Finance, 1,339 in Health, 1,082 in Hotels & Restaurants, 4,059 in Manufacturing, 373 in Mining and Quarrying, 1,012 in Other Community Services, 1,758 in Private Households, 4,635 in Public Administration, 2,480 in Real Estate, 1,399 in Transport & Communications6,722 in Wholesale & Retail Trade. The total number of workers constituted 51,187 with 29,043 males and 22,141 females.[12]
See also
References
- "Sub-national HDI - Area Database - Global Data Lab". hdi.globaldatalab.org. Retrieved 2018-09-13.
- Singh (2011). Geography. Tata McGraw-Hill Education. p. 12.53. ISBN 978-0-07-107480-3.
- Dale, Richard (1995). Botswana's Search for Autonomy in Southern Africa. Greenwood Publishing Group. p. 130. ISBN 9780313295713.
- Picard, Louis A. (1979). "Rural Development in Botswana: Administrative Structures and Public Policy". The Journal of Developing Areas. Louis A. Picard. 13 (3): 283–300. JSTOR 4190662.
- "Regional and Local government in Botswana". Common Wealth of Nations. Retrieved 12 November 2016.
- UN-HABITAT (2002). Local Democracy and Decentralization in East and Southern Africa: Experiences from Uganda, Kenya, Botswana, Tanzania, and Ethiopia. p. 57. ISBN 9789211316667.
- Gaotlhobogwe, Monkagedi. "Botswana broken into 19 new sub-districts". MMegi Online. Retrieved 11 November 2016.
- "2011 Botswana Population and Housing Census" (PDF). Retrieved 11 September 2013.
- Statistics, Botswana. "Population and Housing Census 2022: Population of Cities, Towns and Villages V2" (PDF).
- "Census of Botswana, 2011". Central Statistics Office of Botswana. 2015. Retrieved 12 November 2016.
- "Education details of Botswana, 2011". Central Statistics Office of Botswana. 2015. Archived from the original on 12 November 2016. Retrieved 12 November 2016.
- "Labour Force by industry in Botswana, 2008". Central Statistics Office of Botswana. 2008. Archived from the original on 13 November 2016. Retrieved 12 November 2016.
