St Helens (UK Parliament constituency)
St Helens was a constituency in the county of Lancashire, England. It returned one Member of Parliament (MP) to the House of Commons of the UK Parliament.
| St Helens | |
|---|---|
| Former County constituency for the House of Commons | |
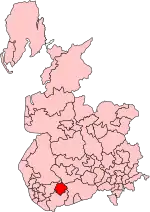
 St Helens in Lancashire, showing boundaries used from 1974-1983 | |
| County | Lancashire |
| Major settlements | St Helens |
| 1885–1983 | |
| Seats | One |
| Created from | South West Lancashire |
| Replaced by | St Helens North and St Helens South |
Created by the Redistribution of Seats Act 1885, the constituency was abolished in 1983, being split into North and South seats.
Boundaries
1885–1918: The municipal borough of St Helens.[1]
1918–1983: The County Borough of St Helens.
Members of Parliament
| Election | Member | Party | Notes | |
|---|---|---|---|---|
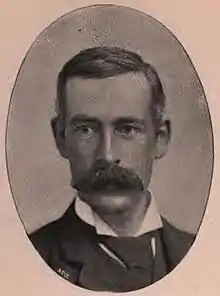
| 1885 | Henry Seton-Karr | Conservative | ||
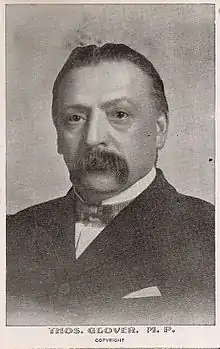
| 1906 | Thomas Glover | Labour | ||
| 1910 | Rigby Swift | Conservative | ||
| 1918 | James Sexton | Labour | ||
| 1931 | Richard Austin Spencer | Conservative | ||
| 1935 | William Albert Robinson | Labour | ||
| 1945 | Hartley Shawcross | Labour | Resigned May 1958 | |
| 1958 by-election | Leslie Spriggs | Labour | ||
| 1983 | constituency abolished | |||
Elections
Elections in the 1880s

| Party | Candidate | Votes | % | ±% | |
|---|---|---|---|---|---|
| Conservative | Henry Seton-Karr | 3,750 | 50.4 | ||
| Liberal | David Gamble | 3,693 | 49.6 | ||
| Majority | 57 | 0.8 | |||
| Turnout | 7,443 | 89.8 | |||
| Registered electors | 8,291 | ||||
| Conservative win (new seat) | |||||
| Party | Candidate | Votes | % | ±% | |
|---|---|---|---|---|---|
| Conservative | Henry Seton-Karr | 3,621 | 51.5 | +1.1 | |
| Liberal | Arthur Sinclair[4] | 3,404 | 48.5 | -1.1 | |
| Majority | 217 | 3.0 | +2.2 | ||
| Turnout | 7,025 | 84.7 | −5.1 | ||
| Registered electors | 8,291 | ||||
| Conservative hold | Swing | +1.1 | |||
Elections in the 1890s
| Party | Candidate | Votes | % | ±% | |
|---|---|---|---|---|---|
| Conservative | Henry Seton-Karr | 4,258 | 50.3 | -1.2 | |
| Liberal | William Rann Kennedy | 4,199 | 49.7 | +1.2 | |
| Majority | 59 | 0.6 | -2.4 | ||
| Turnout | 8,457 | 90.3 | +5.6 | ||
| Registered electors | 9,370 | ||||
| Conservative hold | Swing | -1.2 | |||
| Party | Candidate | Votes | % | ±% | |
|---|---|---|---|---|---|
| Conservative | Henry Seton-Karr | 4,700 | 53.5 | +3.2 | |
| Liberal | John Forster | 4,091 | 46.5 | -3.2 | |
| Majority | 609 | 7.0 | +6.4 | ||
| Turnout | 8,791 | 88.4 | −1.9 | ||
| Registered electors | 9,950 | ||||
| Conservative hold | Swing | +3.2 | |||
Elections in the 1900s
| Party | Candidate | Votes | % | ±% | |
|---|---|---|---|---|---|
| Conservative | Henry Seton-Karr | 5,300 | 60.9 | +7.4 | |
| Liberal | Charles Conybeare | 3,402 | 39.1 | −7.4 | |
| Majority | 1,898 | 21.8 | +14.8 | ||
| Turnout | 8,702 | 80.9 | −7.5 | ||
| Registered electors | 10,763 | ||||
| Conservative hold | Swing | +7.4 | |||

| Party | Candidate | Votes | % | ±% | |
|---|---|---|---|---|---|
| Labour Repr. Cmte. | Thomas Glover | 6,058 | 56.6 | New | |
| Conservative | Henry Seton-Karr | 4,647 | 43.4 | -17.5 | |
| Majority | 1,411 | 13.2 | N/A | ||
| Turnout | 10,705 | 87.9 | +7.0 | ||
| Registered electors | 12,174 | ||||
| Labour Repr. Cmte. gain from Conservative | Swing | N/A | |||
Elections in the 1910s
| Party | Candidate | Votes | % | ±% | |
|---|---|---|---|---|---|
| Labour | Thomas Glover | 6,512 | 53.3 | −3.3 | |
| Conservative | Rigby Swift | 5,717 | 46.7 | +3.3 | |
| Majority | 795 | 6.6 | −6.6 | ||
| Turnout | 12,229 | 93.6 | +5.7 | ||
| Registered electors | 13,068 | ||||
| Labour hold | Swing | −3.3 | |||
| Party | Candidate | Votes | % | ±% | |
|---|---|---|---|---|---|
| Conservative | Rigby Swift | 6,016 | 51.1 | +4.4 | |
| Labour | Thomas Glover | 5,752 | 48.9 | −4.4 | |
| Majority | 264 | 2.2 | N/A | ||
| Turnout | 11,768 | 90.1 | −3.5 | ||
| Registered electors | 13,068 | ||||
| Conservative gain from Labour | Swing | +4.4 | |||
General Election 1914–15: Another General Election was required to take place before the end of 1915. The political parties had been making preparations for an election to take place and by the July 1914, the following candidates had been selected;
- Unionist: Rigby Swift
- Labour: James Sexton
| Party | Candidate | Votes | % | ±% | |
|---|---|---|---|---|---|
| Unionist | Rigby Swift | Unopposed | |||
| Unionist hold | |||||
| Party | Candidate | Votes | % | ±% | |
|---|---|---|---|---|---|
| Labour | James Sexton | 15,583 | 57.1 | +8.2 | |
| C | Unionist | Rigby Swift | 11,689 | 42.9 | −8.2 |
| Majority | 3,894 | 14.2 | N/A | ||
| Turnout | 27,272 | 61.5 | −28.6 | ||
| Labour gain from Unionist | Swing | +8.2 | |||
| C indicates candidate endorsed by the coalition government. | |||||
Elections in the 1920s
| Party | Candidate | Votes | % | ±% | |
|---|---|---|---|---|---|
| Labour | James Sexton | 20,731 | 58.7 | +1.6 | |
| Unionist | Edward Wooll | 14,587 | 41.3 | -1.6 | |
| Majority | 6,144 | 17.4 | +3.2 | ||
| Turnout | 35,318 | 80.0 | +18.5 | ||
| Labour hold | Swing | +1.6 | |||
| Party | Candidate | Votes | % | ±% | |
|---|---|---|---|---|---|
| Labour | James Sexton | 20,086 | 55.5 | -3.2 | |
| Unionist | Margaret Evelyn Pilkington | 16,109 | 44.5 | +3.2 | |
| Majority | 3,977 | 11.0 | -6.4 | ||
| Turnout | 36,195 | 80.5 | +0.5 | ||
| Labour hold | Swing | -3.2 | |||
| Party | Candidate | Votes | % | ±% | |
|---|---|---|---|---|---|
| Labour | James Sexton | 21,313 | 55.8 | +0.3 | |
| Unionist | Margaret Evelyn Pilkington | 16,908 | 44.2 | -0.3 | |
| Majority | 4,405 | 11.6 | +0.6 | ||
| Turnout | 38,221 | 83.1 | +2.6 | ||
| Labour hold | Swing | ||||
| Party | Candidate | Votes | % | ±% | |
|---|---|---|---|---|---|
| Labour | James Sexton | 27,665 | 58.6 | +2.8 | |
| Unionist | Richard Austin Spencer | 19,560 | 41.4 | -2.8 | |
| Majority | 8,105 | 17.2 | +5.6 | ||
| Turnout | 47,225 | 78.3 | -4.8 | ||
| Labour hold | Swing | +2.8 | |||
Elections in the 1930s
| Party | Candidate | Votes | % | ±% | |
|---|---|---|---|---|---|
| Conservative | Richard Austin Spencer | 26,131 | 52.4 | +11.0 | |
| Labour | James Sexton | 23,701 | 47.6 | -11.0 | |
| Majority | 2,430 | 4.8 | N/A | ||
| Turnout | 49,832 | 78.9 | +0.6 | ||
| Conservative gain from Labour | Swing | ||||
| Party | Candidate | Votes | % | ±% | |
|---|---|---|---|---|---|
| Labour | William Robinson | 29,044 | 53.7 | +6.1 | |
| Conservative | Richard Austin Spencer | 25,063 | 46.3 | -6.1 | |
| Majority | 3,981 | 7.4 | +2.6 | ||
| Turnout | 54,107 | 82.6 | +3.7 | ||
| Labour gain from Conservative | Swing | ||||
General Election 1939–40: Another General Election was required to take place before the end of 1940. The political parties had been making preparations for an election to take place and by the Autumn of 1939, the following candidates had been selected;
- Labour: William Robinson[17]
- Conservative: S J Hill
Election in the 1940s
.png.webp)
| Party | Candidate | Votes | % | ±% | |
|---|---|---|---|---|---|
| Labour | Hartley Shawcross | 34,675 | 66.2 | +12.5 | |
| Conservative | Frank Whitworth | 17,686 | 33.8 | -12.5 | |
| Majority | 16,989 | 32.4 | +25.0 | ||
| Turnout | 52,361 | 76.7 | -5.9 | ||
| Labour hold | Swing | +12.5 | |||
Elections in the 1950s
| Party | Candidate | Votes | % | ±% | |
|---|---|---|---|---|---|
| Labour | Hartley Shawcross | 39,514 | 63.2 | -3.0 | |
| Conservative | Alfred Hall-Davis | 20,741 | 33.18 | -0.6 | |
| Liberal | Joseph H Winskill | 2,263 | 3.6 | New | |
| Majority | 18,773 | 30.0 | -2.4 | ||
| Turnout | 62,518 | 84.9 | +8.2 | ||
| Labour hold | Swing | ||||
| Party | Candidate | Votes | % | ±% | |
|---|---|---|---|---|---|
| Labour | Hartley Shawcross | 37,688 | 63.3 | +0.1 | |
| Conservative | Michael Hughes-Young | 21,830 | 36.7 | +3.5 | |
| Majority | 15,858 | 26.6 | -3.4 | ||
| Turnout | 59,518 | 79.7 | -5.2 | ||
| Labour hold | Swing | ||||
| Party | Candidate | Votes | % | ±% | |
|---|---|---|---|---|---|
| Labour | Hartley Shawcross | 35,737 | 64.3 | +1.0 | |
| Conservative | Abram Maxwell Caplin | 19,854 | 35.7 | -1.0 | |
| Majority | 15,883 | 28.6 | +2.0 | ||
| Turnout | 55,591 | 73.5 | -6.2 | ||
| Labour hold | Swing | ||||
| Party | Candidate | Votes | % | ±% | |
|---|---|---|---|---|---|
| Labour | Leslie Spriggs | 26,405 | 64.7 | +0.4 | |
| Conservative | Mark Carlisle | 14,411 | 35.3 | -0.4 | |
| Majority | 11,994 | 29.4 | +0.8 | ||
| Turnout | 40,816 | ||||
| Labour hold | Swing | ||||
| Party | Candidate | Votes | % | ±% | |
|---|---|---|---|---|---|
| Labour | Leslie Spriggs | 35,961 | 62.1 | -2.2 | |
| Conservative | Mark Carlisle | 21,956 | 37.9 | +2.2 | |
| Majority | 14,005 | 24.2 | +4.4 | ||
| Turnout | 57,917 | 76.9 | +3.4 | ||
| Labour hold | Swing | ||||
Elections in the 1960s
| Party | Candidate | Votes | % | ±% | |
|---|---|---|---|---|---|
| Labour | Leslie Spriggs | 34,137 | 67.0 | +4.9 | |
| Conservative | Keith Speed | 16,826 | 33.0 | -4.9 | |
| Majority | 17,311 | 34.0 | +9.8 | ||
| Turnout | 50,963 | 72.3 | -4.6 | ||
| Labour hold | Swing | ||||
| Party | Candidate | Votes | % | ±% | |
|---|---|---|---|---|---|
| Labour | Leslie Spriggs | 33,325 | 70.8 | +3.8 | |
| Conservative | Christopher C. Fielden | 13,776 | 29.2 | −3.8 | |
| Majority | 19,549 | 41.6 | +7.6 | ||
| Turnout | 47,101 | 68.6 | -3.7 | ||
| Labour hold | Swing | ||||
Elections in the 1970s
| Party | Candidate | Votes | % | ±% | |
|---|---|---|---|---|---|
| Labour | Leslie Spriggs | 31,587 | 65.7 | -5.1 | |
| Conservative | Ian D. McGaw | 16,509 | 34.3 | +5.1 | |
| Majority | 15,078 | 31.4 | -10.1 | ||
| Turnout | 48,096 | 64.5 | -4.1 | ||
| Labour hold | Swing | ||||
| Party | Candidate | Votes | % | ±% | |
|---|---|---|---|---|---|
| Labour | Leslie Spriggs | 32,621 | 59.0 | -6.7 | |
| Liberal | AE Lycett | 10,905 | 19.7 | New | |
| Conservative | KJ Bridgeman | 10,752 | 19.5 | -14.8 | |
| Ind. Labour Party | M Pike | 991 | 1.8 | New | |
| Majority | 21,716 | 39.3 | +7.9 | ||
| Turnout | 55,269 | 73.2 | +8.7 | ||
| Labour hold | Swing | ||||
| Party | Candidate | Votes | % | ±% | |
|---|---|---|---|---|---|
| Labour | Leslie Spriggs | 32,620 | 64.1 | +5.1 | |
| Conservative | K.J. Bridgeman | 10,554 | 20.8 | +1.3 | |
| Liberal | A.E. Lycett | 7,689 | 15.1 | −4.6 | |
| Majority | 22,066 | 43.3 | +4.0 | ||
| Turnout | 50,863 | 66.9 | -6.3 | ||
| Labour hold | Swing | ||||
| Party | Candidate | Votes | % | ±% | |
|---|---|---|---|---|---|
| Labour | Leslie Spriggs | 32,489 | 59.6 | −4.5 | |
| Conservative | J. Brown | 16,934 | 31.1 | +10.3 | |
| Liberal | I. Smith | 4,587 | 8.4 | −6.7 | |
| Workers Revolutionary | J. Boylan | 471 | 0.9 | New | |
| Majority | 15,555 | 28.5 | -14.9 | ||
| Turnout | 54,481 | 72.8 | +5.9 | ||
| Labour hold | Swing | ||||
References
- "Chap. 23. Redistribution of Seats Act, 1885". The Public General Acts of the United Kingdom passed in the forty-eighth and forty-ninth years of the reign of Queen Victoria. London: Eyre and Spottiswoode. 1885. pp. 111–198.
- British parliamentary election results, 1885-1918 (Craig)
- British parliamentary election results, 1885-1918 (Craig)
- "The Candidates for St. Helens". Liverpool Mercury. 19 June 1886. p. 6. Retrieved 10 December 2017 – via British Newspaper Archive.
- British parliamentary election results, 1885-1918 (Craig)
- British parliamentary election results, 1885-1918 (Craig)
- British parliamentary election results, 1885-1918 (Craig)
- British parliamentary election results, 1885-1918 (Craig)
- British parliamentary election results, 1885-1918 (Craig)
- British parliamentary election results, 1885-1918 (Craig)
- British parliamentary election results, 1885-1918 (Craig)
- British Parliamentary Election Results 1918-1949, FWS Craig
- British Parliamentary Election Results 1918-1949, FWS Craig
- British Parliamentary Election Results 1918-1949, FWS Craig
- British Parliamentary Election Results 1918-1949, FWS Craig
- British Parliamentary Election Results 1918-1949, FWS Craig
- Report of the Annual Conference of the Labour Party, 1939
- British Parliamentary Election Results 1918-1949, FWS Craig