State diagram
A state diagram is a type of diagram used in computer science and related fields to describe the behavior of systems. State diagrams require that the system described is composed of a finite number of states; sometimes, this is indeed the case, while at other times this is a reasonable abstraction. Many forms of state diagrams exist, which differ slightly and have different semantics.

Overview
State diagrams are used to give an abstract description of the behavior of a system. This behavior is analyzed and represented by a series of events that can occur in one or more possible states. Hereby "each diagram usually represents objects of a single class and track the different states of its objects through the system".[1]
State diagrams can be used to graphically represent finite-state machines (also called finite automata). This was introduced by Claude Shannon and Warren Weaver in their 1949 book The Mathematical Theory of Communication. Another source is Taylor Booth in his 1967 book Sequential Machines and Automata Theory. Another possible representation is the state-transition table.
Directed graph
A classic form of state diagram for a finite automaton (FA) is a directed graph with the following elements (Q, Σ, Z, δ, q0, F):[2][3]
- Vertices Q: a finite set of states, normally represented by circles and labeled with unique designator symbols or words written inside them
- Input symbols Σ: a finite collection of input symbols or designators
- Output symbols Z: a finite collection of output symbols or designators
The output function ω represents the mapping of ordered pairs of input symbols and states onto output symbols, denoted mathematically as ω : Σ × Q→ Z.
- Edges δ: represent transitions from one state to another as caused by the input (identified by their symbols drawn on the edges). An edge is usually drawn as an arrow directed from the present state to the next state. This mapping describes the state transition that is to occur on input of a particular symbol. This is written mathematically as δ : Q × Σ → Q, so δ (the transition function) in the definition of the FA is given by both the pair of vertices connected by an edge and the symbol on an edge in a diagram representing this FA. Item δ(q, a) = p in the definition of the FA means that from the state named q under input symbol a, the transition to the state p occurs in this machine. In the diagram representing this FA, this is represented by an edge labeled by a pointing from the vertex labeled by q to the vertex labeled by p.
- Start state q0: (not shown in the examples below). The start state q0 ∈ Q is usually represented by an arrow with no origin pointing to the state. In older texts,[2][4] the start state is not shown and must be inferred from the text.
- Accepting state(s) F: If used, for example for accepting automata, F ∈ Q is the accepting state. It is usually drawn as a double circle. Sometimes the accept state(s) function as "Final" (halt, trapped) states.[3]
For a deterministic finite automaton (DFA), nondeterministic finite automaton (NFA), generalized nondeterministic finite automaton (GNFA), or Moore machine, the input is denoted on each edge. For a Mealy machine, input and output are signified on each edge, separated with a slash "/": "1/0" denotes the state change upon encountering the symbol "1" causing the symbol "0" to be output. For a Moore machine the state's output is usually written inside the state's circle, also separated from the state's designator with a slash "/". There are also variants that combine these two notations.
For example, if a state has a number of outputs (e.g. "a= motor counter-clockwise=1, b= caution light inactive=0") the diagram should reflect this : e.g. "q5/1,0" designates state q5 with outputs a=1, b=0. This designator will be written inside the state's circle.
Example: DFA, NFA, GNFA, or Moore machine
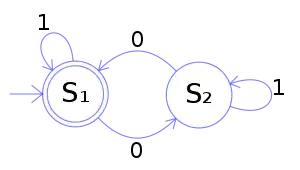
S1 and S2 are states and S1 is an accepting state or a final state. Each edge is labeled with the input. This example shows an acceptor for binary numbers that contain an even number of zeros.
Example: Mealy machine
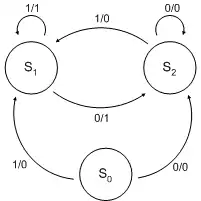
S0, S1, and S2 are states. Each edge is labeled with "j / k" where j is the input and k is the output.
Harel statechart

Harel statecharts,[5] invented by computer scientist David Harel, are gaining widespread usage since a variant has become part of the Unified Modeling Language (UML). The diagram type allows the modeling of superstates, orthogonal regions, and activities as part of a state.
Classic state diagrams require the creation of distinct nodes for every valid combination of parameters that define the state. This can lead to a very large number of nodes and transitions between nodes for all but the simplest of systems (state and transition explosion). This complexity reduces the readability of the state diagram. With Harel statecharts it is possible to model multiple cross-functional state diagrams within the statechart. Each of these cross-functional state machines can transition internally without affecting the other state machines in the statechart. The current state of each cross-functional state machine in the statechart defines the state of the system. The Harel statechart is equivalent to a state diagram but it improves the readability of the resulting diagram.
Alternative semantics
There are other sets of semantics available to represent state diagrams. For example, there are tools for modeling and designing logic for embedded controllers.[6] These diagrams, like Harel's original state machines,[7] support hierarchically nested states, orthogonal regions, state actions, and transition actions.[8]
State diagrams versus flowcharts
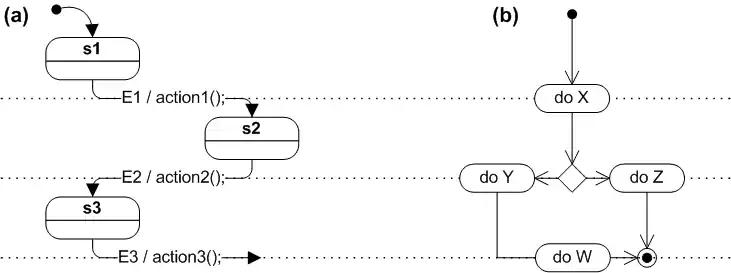
Newcomers to the state machine formalism often confuse state diagrams with flowcharts. The figure below shows a comparison of a state diagram with a flowchart. A state machine (panel (a)) performs actions in response to explicit events. In contrast, the flowchart (panel (b)) does not need explicit events but rather transitions from node to node in its graph automatically upon completion of activities.[9]
Nodes of flowcharts are edges in the induced graph of states. The reason is that each node in a flowchart represents a program command. A program command is an action to be executed. So it is not a state, but when applied to the program's state, it results in a transition to another state.
In more detail, the source code listing represents a program graph. Executing the program graph (parsing and interpreting) results in a state graph. So each program graph induces a state graph. Conversion of the program graph to its associated state graph is called "unfolding" of the program graph.
The program graph is a sequence of commands. If no variables exist, then the state consists only of the program counter, which keeps track of where in the program we are during execution (what is the next command to be applied).
In this case before executing a command the program counter is at some position (state before the command is executed). Executing the command moves the program counter to the next command. Since the program counter is the whole state, it follows that executing the command changed the state. So the command itself corresponds to a transition between the two states.
Now consider the full case, when variables exist and are affected by the program commands being executed. Then between different program counter locations, not only does the program counter change, but variables might also change values, due to the commands executed. Consequently, even if we revisit some program command (e.g. in a loop), this doesn't imply the program is in the same state.
In the previous case, the program would be in the same state, because the whole state is just the program counter, so if the program counterpoints to the same position (next command) it suffices to specify that we are in the same state. However, if the state includes variables, then if those change value, we can be at the same program location with different variable values, meaning in a different state in the program's state space. The term "unfolding" originates from this multiplication of locations when producing the state graph from the program graph.
A self transition is a transition where the initial and the final state are the same.
A representative example is a do loop incrementing some counter until it overflows and becomes 0 again. Although the do loop executes the same increment command iteratively, so the program graph executes a cycle, in its state space is not a cycle, but a line. This results from the state being the program location (here cycling) combined with the counter value, which is strictly increasing (until the overflow), so different states are visited in sequence, until the overflow. After the overflow the counter becomes 0 again, so the initial state is revisited in the state space, closing a cycle in the state space (assuming the counter was initialized to 0).
The figure above attempts to show that reversal of roles by aligning the arcs of the state diagrams with the processing stages of the flowchart.
You can compare a flowchart to an assembly line in manufacturing because the flowchart describes the progression of some task from beginning to end (e.g., transforming source code input into object code output by a compiler). A state machine generally has no notion of such a progression. The door state machine shown at the top of this article, for example, is not in a more advanced stage when it is in the "closed" state, compared to being in the "opened" state; it simply reacts differently to the open/close events. A state in a state machine is an efficient way of specifying a particular behavior, rather than a stage of processing.
Other extensions
An interesting extension is to allow arcs to flow from any number of states to any number of states. This only makes sense if the system is allowed to be in multiple states at once, which implies that an individual state only describes a condition or other partial aspect of the overall, global state. The resulting formalism is known as a Petri net.
Another extension allows the integration of flowcharts within Harel statecharts. This extension supports the development of software that is both event driven and workflow driven.
See also
- David Harel
- DRAKON
- SCXML an XML language that provides a generic state-machine based execution environment based on Harel statecharts.
- UML state machine
- YAKINDU Statechart Tools is a software for modeling state diagrams (Harel statecharts, Mealy machines, Moore machines), simulation, and source code generation.
References
- Archive index at the Wayback Machine
- Taylor Booth (1967) Sequential Machines and Automata Theory, John Wiley and Sons, New York.
- John Hopcroft and Jeffrey Ullman (1979) Introduction to Automata Theory, Languages, and Computation, Addison-Wesley Publishing Company, Reading Mass, ISBN 0-201-02988-X
- Edward J. McClusky, Introduction to the Theory of Switching Circuits, McGraw-Hill, 1965
- David Harel, Statecharts: A visual formalism for complex systems. Science of Computer Programming, 8(3):231–274, June 1987.
- Tiwari, A. (2002). Formal Semantics and Analysis Methods for Simulink Stateflow.
- Harel, D. (1987). A Visual Formalism for Complex Systems. Science of Computer Programming , 231–274.
- Alur, R., Kanade, A., Ramesh, S., & Shashidhar, K. C. (2008). Symbolic analysis for improving simulation coverage of Simulink/Stateflow models. International Conference on Embedded Software (pp. 89–98). Atlanta, GA: ACM.
- Samek, Miro (2008). Practical UML Statecharts in C/C++, Second Edition: Event-Driven Programming for Embedded Systems. Newnes. p. 728. ISBN 978-0-7506-8706-5.
External links
- Introduction to UML 2 State Machine Diagrams by Scott W. Ambler
- UML 2 State Machine Diagram Guidelines by Scott W. Ambler
- Intelliwizard - UML StateWizard - A discontinued round-trip UML dynamic modeling/development framework and tool that ran in popular IDEs under an open-source license.
- YAKINDU Statechart Tools - an Open-Source-Tool for the specification and development of reactive, event-driven systems with the help of state machines.
- Understanding and Using State Machines MATLAB Tech Talks on State Machines
- FSM: Open Source Finite State Machine Generation in Java by Alexander Sakharov FSM
- scxmlcc An efficient scxml state machine to C++ compiler.
- SMC: An Open Source State Machine Compiler that generates FSM for many languages as C, Python, Lua, Scala, PHP, Java, VB, etc. SMC


