Stormont—Dundas—South Glengarry (provincial electoral district)
Stormont—Dundas—South Glengarry is a provincial electoral district in eastern Ontario, Canada. It was created for the 2007 provincial election. 95.5% came from Stormont—Dundas—Charlottenburgh while 4.5% came from Glengarry—Prescott—Russell.
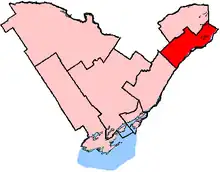 Stormont—Dundas—South Glengarry in relation to other eastern Ontario electoral districts | |||
| Provincial electoral district | |||
| Legislature | Legislative Assembly of Ontario | ||
| MPP |
Progressive Conservative | ||
| District created | 2004 | ||
| First contested | 2007 | ||
| Last contested | 2022 | ||
| Demographics | |||
| Population (2016) | 103,320 | ||
| Electors (2018) | 81,342 | ||
| Area (km²) | 2,812 | ||
| Pop. density (per km²) | 36.7 | ||
| Census division(s) | Stormont, Dundas and Glengarry United Counties | ||
| Census subdivision(s) | Cornwall, South Glengarry, South Stormont, North Dundas, South Dundas, North Stormont | ||
The riding includes all of the united counties of Stormont, Dundas and Glengarry except for the Township of North Glengarry.
Members of Provincial Parliament
| Stormont—Dundas—South Glengarry | ||||
|---|---|---|---|---|
| Assembly | Years | Member | Party | |
| Stormont—Dundas—Charlottenburgh | ||||
| Riding created from Cornwall and Stormont—Dundas—Glengarry and East Grenville | ||||
| 37th | 1999–2003 | John Cleary | Liberal | |
| 38th | 2003–2007 | Jim Brownell | ||
| Stormont—Dundas—South Glengarry | ||||
| 39th | 2007–2011 | Jim Brownell | Liberal | |
| 40th | 2011–2014 | Jim McDonell | Progressive Conservative | |
| 41st | 2014–2018 | |||
| 42nd | 2018–2022 | |||
| 43rd | 2022–present | Nolan Quinn | ||
Election results
| 2022 Ontario general election | ||||||||
|---|---|---|---|---|---|---|---|---|
| Party | Candidate | Votes | % | ±% | ||||
| Progressive Conservative | Nolan Quinn | 20,766 | 57.50 | -4.01 | ||||
| Liberal | Kirsten J. Gardner | 6,458 | 17.88 | +5.51 | ||||
| New Democratic | Wendy Stephen | 4,982 | 13.80 | -7.83 | ||||
| New Blue | Claude Tardif | 1,538 | 4.26 | |||||
| Green | Jacqueline Milner | 1,477 | 4.09 | +0.42 | ||||
| Ontario Party | Remi Tremblay | 893 | 2.47 | |||||
| Total valid votes | 36,114 | |||||||
| Total rejected, unmarked and declined ballots | 214 | |||||||
| Turnout | 36,328 | 41.63 | -12.47 | |||||
| Eligible voters | 87,263 | |||||||
| Progressive Conservative hold | Swing | -4.76 | ||||||
| Source: Elections Ontario[1] | ||||||||
| 2018 Ontario general election: Stormont—Dundas—South Glengarry | ||||||||
|---|---|---|---|---|---|---|---|---|
| Party | Candidate | Votes | % | ±% | ||||
| Progressive Conservative | Jim McDonell | 26,780 | 61.51 | +9.79 | ||||
| New Democratic | Marc Benoit | 9,416 | 21.63 | +0.72 | ||||
| Liberal | Heather Megill | 5,386 | 12.37 | -10.82 | ||||
| Green | Elaine Kennedy | 1,596 | 3.67 | +0.99 | ||||
| Libertarian | Sabile Trimm | 360 | 0.83 | -0.68 | ||||
| Total valid votes | 43,538 | 98.93 | ||||||
| Total rejected, unmarked and declined ballots | 471 | 1.07 | -0.08 | |||||
| Turnout | 44,009 | 54.10 | +2.08 | |||||
| Eligible voters | 81,342 | |||||||
| Progressive Conservative hold | Swing | +4.53 | ||||||
| Source: Elections Ontario[2] | ||||||||
| 2014 Ontario general election | ||||||||
|---|---|---|---|---|---|---|---|---|
| Party | Candidate | Votes | % | ±% | ||||
| Progressive Conservative | Jim McDonell | 20,624 | 51.72 | -3.54 | ||||
| Liberal | John Earle | 9,250 | 23.20 | +1.54 | ||||
| New Democratic | Elaine MacDonald | 8,336 | 20.90 | +0.25 | ||||
| Green | Sharron Norman | 1,067 | 2.68 | +1.26 | ||||
| Libertarian | Shawn McRae | 602 | 1.51 | +0.49 | ||||
| Total valid votes | 39,879 | 98.85 | ||||||
| Total rejected, unmarked and declined ballots | 463 | 1.15 | ||||||
| Turnout | 40,342 | 52.02 | ||||||
| Eligible voters | 77,544 | |||||||
| Progressive Conservative hold | Swing | -2.54 | ||||||
| Source: Elections Ontario[3] | ||||||||
| 2011 Ontario general election | ||||||||
|---|---|---|---|---|---|---|---|---|
| Party | Candidate | Votes | % | ±% | ||||
| Progressive Conservative | Jim McDonell | 21,463 | 55.25 | +16.47 | ||||
| Liberal | Mark A. Macdonald | 8,413 | 21.66 | -27.17 | ||||
| New Democratic | Elaine MacDonald | 8,021 | 20.65 | +13.32 | ||||
| Green | Justin Reist | 551 | 1.42 | -2.98 | ||||
| Libertarian | Darcy Neal Donnelly | 396 | 1.02 | |||||
| Total valid votes | 38,844 | 100.00 | ||||||
| Total rejected, unmarked and declined ballots | 205 | 0.52 | ||||||
| Turnout | 39,049 | 51.40 | ||||||
| Eligible voters | 75,975 | |||||||
| Progressive Conservative gain from Liberal | Swing | +21.82 | ||||||
| Source: Elections Ontario[4] | ||||||||
| 2007 Ontario general election | ||||||||
|---|---|---|---|---|---|---|---|---|
| Party | Candidate | Votes | % | |||||
| Liberal | Jim Brownell | 18,609 | 48.83 | |||||
| Progressive Conservative | Chris Savard | 14,782 | 38.78 | |||||
| New Democratic | Lori Taylor | 2,795 | 7.33 | |||||
| Green | Elaine Kennedy | 1,678 | 4.40 | |||||
| Family Coalition | Lukas Bebjak | 249 | 0.65 | |||||
| Total valid votes | 38,113 | 100.0 | ||||||
Stormont—Dundas—Charlottenburgh
| 2003 Ontario general election | ||||||||
|---|---|---|---|---|---|---|---|---|
| Party | Candidate | Votes | % | ±% | ||||
| Liberal | Jim Brownell | 19,558 | 51.18 | +3.19 | ||||
| Progressive Conservative | Todd Lalonde | 13,948 | 36.5 | -9.97 | ||||
| Green | Tom Manley | 2,098 | 5.49 | |||||
| New Democratic | Matt Z. Sumegi | 1,639 | 4.29 | -0.47 | ||||
| Independent | Gary Besner | 968 | 2.53 | |||||
| Total valid votes | 38,211 | 100.0 | ||||||
| 1999 Ontario general election | ||||||||
|---|---|---|---|---|---|---|---|---|
| Party | Candidate | Votes | % | |||||
| Liberal | John Cleary | 20,275 | 47.99 | |||||
| Progressive Conservative | Noble Villeneuve | 19,635 | 46.47 | |||||
| New Democratic | Maggie Macdonald | 2,012 | 4.76 | |||||
| Natural Law | Ian Campbell | 329 | 0.78 | |||||
| Total valid votes | 42,251 | 100.0 | ||||||
2007 electoral reform referendum
| 2007 Ontario electoral reform referendum | |||
|---|---|---|---|
| Side | Votes | % | |
| First Past the Post | 27,491 | 73.2 | |
| Mixed member proportional | 10,063 | 26.8 | |
| Total valid votes | 37,554 | 100.0 | |
Sources
- "Vote Totals From Official Tabulation" (PDF). Elections Ontario. Retrieved 26 January 2023.
- "Summary of Valid Votes Cast for each Candidate" (PDF). Elections Ontario. p. 10. Retrieved 20 January 2019.
- Elections Ontario (2014). "General Election Results by District, 087 Stormont-Dundas-South Glengarry". Retrieved 13 June 2014.
- Elections Ontario (2011). "Official return from the records / Rapport des registres officiels - Stormont—Dundas—South Glengarry" (PDF). Retrieved 2 June 2014.
This article is issued from Wikipedia. The text is licensed under Creative Commons - Attribution - Sharealike. Additional terms may apply for the media files.