1976 Swedish general election
General elections were held in Sweden on 19 September 1976.[1] Although the Swedish Social Democratic Party remained the largest party, winning 152 of the 349 seats in the Riksdag,[2] a coalition government was formed with the Centre Party, the People's Party and the conservative Moderate Party (who won a combined 180 seats), which formed Sweden's first non-socialist government since 1936. Centre Party leader Thorbjörn Fälldin, who had widely been expected to take over the government in the previous election of 1973 (which turned out to bring a 175-175 draw between the left and right blocs), was appointed Prime Minister, the first not from the Swedish Social Democratic Party since Axel Pehrsson-Bramstorp's brief interregnum 40 years earlier.
| ||||||||||||||||||||||||||||||||||||||||||||||||||||||||||||||||||||
All 349 seats in the Riksdag 175 seats needed for a majority | ||||||||||||||||||||||||||||||||||||||||||||||||||||||||||||||||||||
|---|---|---|---|---|---|---|---|---|---|---|---|---|---|---|---|---|---|---|---|---|---|---|---|---|---|---|---|---|---|---|---|---|---|---|---|---|---|---|---|---|---|---|---|---|---|---|---|---|---|---|---|---|---|---|---|---|---|---|---|---|---|---|---|---|---|---|---|---|
| ||||||||||||||||||||||||||||||||||||||||||||||||||||||||||||||||||||
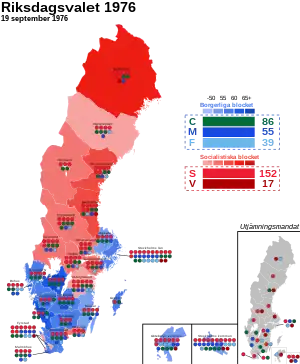 Map of the election, showing the distribution of constituency and levelling seats, as well as the largest political bloc within each constituency. | ||||||||||||||||||||||||||||||||||||||||||||||||||||||||||||||||||||
| ||||||||||||||||||||||||||||||||||||||||||||||||||||||||||||||||||||
.jpg.webp)

.jpg.webp)


Results
 | |||||
|---|---|---|---|---|---|
| Party | Votes | % | Seats | +/– | |
| Swedish Social Democratic Party | 2,324,603 | 42.75 | 152 | –4 | |
| Centre Party | 1,309,669 | 24.08 | 86 | –4 | |
| Moderate Party | 847,672 | 15.59 | 55 | +4 | |
| People's Party | 601,556 | 11.06 | 39 | +5 | |
| Left Party Communists | 258,432 | 4.75 | 17 | –2 | |
| Christian Democratic Unity | 73,844 | 1.36 | 0 | 0 | |
| Communist Party | 17,309 | 0.32 | 0 | 0 | |
| Other parties | 4,663 | 0.09 | 0 | 0 | |
| Total | 5,437,748 | 100.00 | 349 | –1 | |
| Valid votes | 5,437,748 | 99.65 | |||
| Invalid/blank votes | 19,295 | 0.35 | |||
| Total votes | 5,457,043 | 100.00 | |||
| Registered voters/turnout | 5,947,077 | 91.76 | |||
| Source: Nohlen & Stöver | |||||
Seat distribution
| Constituency | Total seats |
Seats won | |||||||
|---|---|---|---|---|---|---|---|---|---|
| By party | By coalition | ||||||||
| S | C | M | F | V | Right | Left | |||
| Älvsborg North | 9 | 4 | 3 | 1 | 1 | 5 | 4 | ||
| Älvsborg South | 8 | 3 | 2 | 2 | 1 | 5 | 3 | ||
| Blekinge | 7 | 3 | 2 | 1 | 1 | 4 | 3 | ||
| Bohus | 11 | 4 | 3 | 2 | 2 | 7 | 4 | ||
| Fyrstadskretsen | 19 | 9 | 3 | 4 | 2 | 1 | 9 | 10 | |
| Gävleborg | 13 | 6 | 3 | 1 | 1 | 2 | 5 | 8 | |
| Gothenburg | 19 | 7 | 3 | 3 | 4 | 2 | 10 | 9 | |
| Gotland | 2 | 1 | 1 | 1 | 1 | ||||
| Halland | 9 | 3 | 3 | 2 | 1 | 6 | 3 | ||
| Jämtland | 5 | 3 | 2 | 2 | 3 | ||||
| Jönköping | 13 | 5 | 4 | 2 | 2 | 8 | 5 | ||
| Kalmar | 11 | 5 | 3 | 2 | 1 | 6 | 5 | ||
| Kopparberg | 13 | 6 | 4 | 1 | 1 | 1 | 6 | 7 | |
| Kristianstad | 12 | 5 | 4 | 2 | 1 | 7 | 5 | ||
| Kronoberg | 7 | 3 | 3 | 1 | 4 | 3 | |||
| Malmöhus | 11 | 5 | 3 | 2 | 1 | 6 | 5 | ||
| Norrbotten | 12 | 6 | 2 | 1 | 1 | 2 | 4 | 8 | |
| Örebro | 11 | 6 | 3 | 1 | 1 | 5 | 6 | ||
| Östergötland | 18 | 8 | 4 | 3 | 2 | 1 | 9 | 9 | |
| Skaraborg | 11 | 4 | 4 | 2 | 1 | 7 | 4 | ||
| Södermanland | 9 | 5 | 2 | 1 | 1 | 4 | 5 | ||
| Stockholm County | 33 | 12 | 6 | 7 | 5 | 3 | 18 | 15 | |
| Stockholm Municipality | 32 | 12 | 4 | 8 | 4 | 4 | 16 | 16 | |
| Uppsala | 10 | 4 | 3 | 1 | 1 | 1 | 5 | 5 | |
| Värmland | 12 | 6 | 3 | 2 | 1 | 6 | 6 | ||
| Västerbotten | 10 | 5 | 3 | 1 | 1 | 5 | 5 | ||
| Västernorrland | 13 | 7 | 4 | 1 | 1 | 6 | 7 | ||
| Västmanland | 9 | 5 | 2 | 1 | 1 | 4 | 5 | ||
| Total | 349 | 152 | 86 | 55 | 39 | 17 | 180 | 169 | |
| Source: Statistics Sweden | |||||||||
By municipality
 Votes by municipality. The municipalities are the color of the party that got the most votes within the coalition that won relative majority.
 Cartogram of the map to the left with each municipality rescaled to the number of valid votes cast.
 Map showing the voting shifts from the 1973 to the 1976 election. Darker blue indicates a municipality voted more towards the parties that formed the centre-right bloc. Darker red indicates a municipality voted more towards the parties that form the left-wing bloc.
 Votes by municipality as a scale from red/Left-wing bloc to blue/Centre-right bloc.
 Cartogram of vote with each municipality rescaled in proportion to number of valid votes cast. Deeper blue represents a relative majority for the centre-right coalition, brighter red represents a relative majority for the left-wing coalition.