Szentkirályszabadja
Szentkirályszabadja is a village in Veszprém county, Hungary. For many years it was the home of the 87th Bakony Combat Helicopter Regiment of the 5th Army, Hungarian People's Army.[1]
Szentkirályszabadja | |
|---|---|
 Coat of arms | |
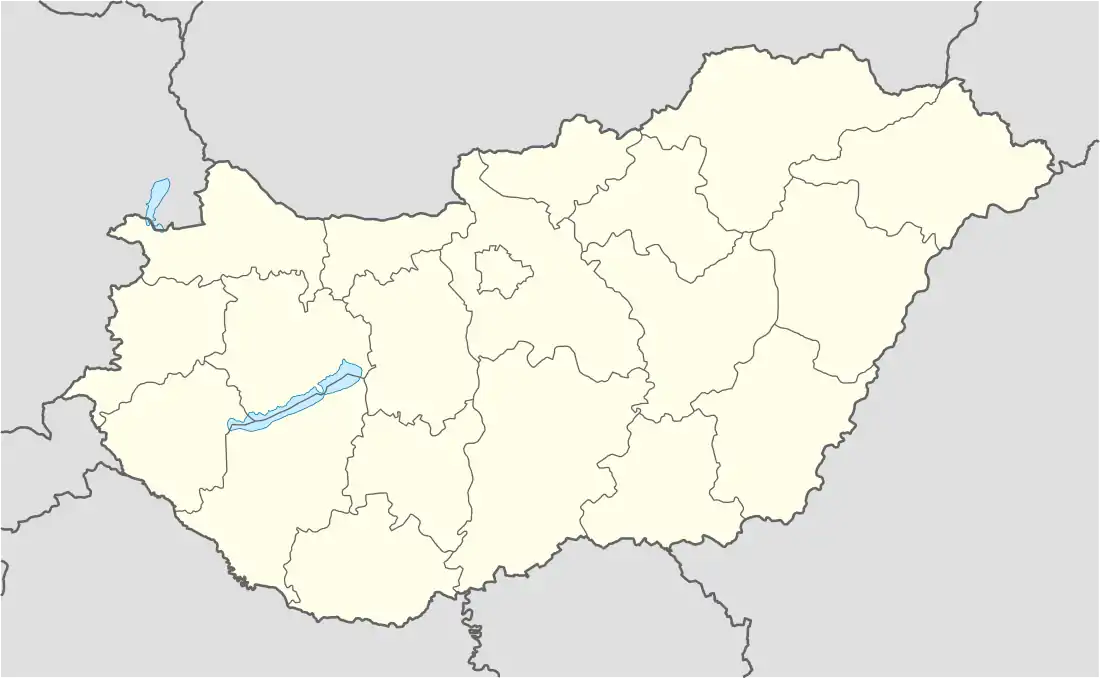 Szentkirályszabadja Location of Szentkirályszabadja | |
| Coordinates: 47.05723°N 17.97101°E | |
| Country | |
| County | Veszprém |
| Area | |
| • Total | 22.39 km2 (8.64 sq mi) |
| Population (2004) | |
| • Total | 2,150 |
| • Density | 96.02/km2 (248.7/sq mi) |
| Time zone | UTC+1 (CET) |
| • Summer (DST) | UTC+2 (CEST) |
| Postal code | 8225 |
| Area code | 88 |
Climate
Szentkirályszabadja's climate is classified as oceanic climate (Köppen Cfb). The annual average temperature is 10.5 °C (50.9 °F), the hottest month in July is 21.1 °C (70.0 °F), and the coldest month is −0.4 °C (31.3 °F) in January. The annual precipitation is 584.3 millimetres (23.00 in), of which June is the wettest with 67.9 millimetres (2.67 in), while March is the driest with only 28.1 millimetres (1.11 in). The extreme temperature throughout the year ranged from −19.9 °C (−3.8 °F) on December 31, 1996 to 38.2 °C (100.8 °F) on July 20, 2007.
| Climate data for Szentkirályszabadja, 1991−2020 normals | |||||||||||||
|---|---|---|---|---|---|---|---|---|---|---|---|---|---|
| Month | Jan | Feb | Mar | Apr | May | Jun | Jul | Aug | Sep | Oct | Nov | Dec | Year |
| Record high °C (°F) | 17.2 (63.0) |
19.9 (67.8) |
22.1 (71.8) |
28.6 (83.5) |
31.0 (87.8) |
34.4 (93.9) |
38.2 (100.8) |
37.9 (100.2) |
32.0 (89.6) |
26.1 (79.0) |
21.5 (70.7) |
16.6 (61.9) |
38.2 (100.8) |
| Average high °C (°F) | 2.8 (37.0) |
5.1 (41.2) |
10.2 (50.4) |
16.2 (61.2) |
20.7 (69.3) |
24.5 (76.1) |
26.7 (80.1) |
26.6 (79.9) |
20.9 (69.6) |
15.3 (59.5) |
8.5 (47.3) |
3.3 (37.9) |
15.1 (59.2) |
| Daily mean °C (°F) | −0.4 (31.3) |
1.3 (34.3) |
5.5 (41.9) |
11.0 (51.8) |
15.3 (59.5) |
19.2 (66.6) |
21.1 (70.0) |
20.9 (69.6) |
15.7 (60.3) |
10.5 (50.9) |
5.0 (41.0) |
0.4 (32.7) |
10.5 (50.9) |
| Average low °C (°F) | −3.2 (26.2) |
−2.2 (28.0) |
1.5 (34.7) |
6.0 (42.8) |
10.2 (50.4) |
14.0 (57.2) |
15.9 (60.6) |
15.7 (60.3) |
11.2 (52.2) |
6.5 (43.7) |
2.1 (35.8) |
−2.1 (28.2) |
6.3 (43.3) |
| Record low °C (°F) | −18.4 (−1.1) |
−18.0 (−0.4) |
−19.3 (−2.7) |
−5.0 (23.0) |
0.6 (33.1) |
4.5 (40.1) |
8.0 (46.4) |
7.2 (45.0) |
2.1 (35.8) |
−8.8 (16.2) |
−12.6 (9.3) |
−19.9 (−3.8) |
−19.9 (−3.8) |
| Average precipitation mm (inches) | 28.8 (1.13) |
29.4 (1.16) |
28.1 (1.11) |
35.3 (1.39) |
61.8 (2.43) |
67.9 (2.67) |
65.2 (2.57) |
66.2 (2.61) |
60.8 (2.39) |
52.0 (2.05) |
49.9 (1.96) |
38.9 (1.53) |
584.3 (23.00) |
| Average precipitation days (≥ 1.0 mm) | 5.4 | 5.3 | 5.1 | 5.8 | 8.0 | 7.3 | 7.7 | 6.4 | 6.5 | 6.3 | 7.2 | 6.4 | 77.4 |
| Average relative humidity (%) | 82.6 | 76.7 | 68.5 | 63.0 | 67.4 | 67.7 | 65.1 | 65.8 | 72.1 | 78.3 | 85.5 | 85.1 | 73.2 |
| Source: NOAA[2] | |||||||||||||
Gallery


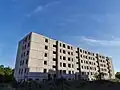 Szentkirályszabadja, abandoned Russian barracks
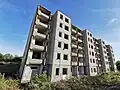 Szentkirályszabadja, abandoned Russian barracks
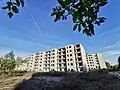 Szentkirályszabadja, abandoned Russian barracks
References
- https://dailynewshungary.com/ghost-city-recurring-tourists-photos-video/ and http://www.ww2.dk/new (Warsaw Pact, Hungary page).
- "Szentkirályszabadja Climate Normals 1991-2020". National Oceanic and Atmospheric Administration. Archived from the original on 2023-09-20. Retrieved September 20, 2023.
This article is issued from Wikipedia. The text is licensed under Creative Commons - Attribution - Sharealike. Additional terms may apply for the media files.