Tha Tum district
Tha Tum (Thai: ท่าตูม, pronounced [tʰâː tūːm]) is a district (amphoe) in the northern part of Surin province, northeastern Thailand.
Tha Tum
ท่าตูม | |
|---|---|
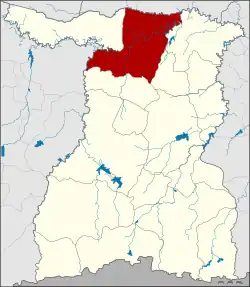 District location in Surin province | |
| Coordinates: 15°19′6″N 103°40′30″E | |
| Country | Thailand |
| Province | Surin |
| Area | |
| • Total | 643.3 km2 (248.4 sq mi) |
| Population (2005) | |
| • Total | 97,390 |
| • Density | 151.4/km2 (392/sq mi) |
| Time zone | UTC+7 (ICT) |
| Postal code | 32120 |
| Geocode | 3203 |
Geography
Neighboring districts are (from the east clockwise): Rattanaburi, Sanom and Chom Phra of Surin Province; Satuek of Buriram province; Chumphon Buri of Surin; Kaset Wisai and Suwannaphum of Roi Et province.
Administration
The district is divided into 10 sub-districts (tambons), which are further subdivided into 165 villages (mubans). Tha Tum is a township (thesaban tambon) which covers parts of tambon Tha Tum. There are a further 10 tambon administrative organizations (TAO).
| No. | Name | Thai name | Villages | Pop. | |
|---|---|---|---|---|---|
| 1. | Tha Tum | ท่าตูม | 22 | 19,198 | |
| 2. | Krapho | กระโพ | 20 | 15,789 | |
| 3. | Phrom Thep | พรมเทพ | 22 | 7,969 | |
| 4. | Phon Khrok | โพนครก | 16 | 9,344 | |
| 5. | Mueang Kae | เมืองแก | 19 | 10,173 | |
| 6. | Ba | บะ | 15 | 6,555 | |
| 7. | Nong Bua | หนองบัว | 11 | 7,417 | |
| 8. | Bua Khok | บัวโคก | 19 | 9,700 | |
| 9. | Nong Methi | หนองเมธี | 11 | 5,976 | |
| 10. | Thung Kula | ทุ่งกุลา | 10 | 5,269 |
Climate
| Climate data for Tha Tum (1991–2020) | |||||||||||||
|---|---|---|---|---|---|---|---|---|---|---|---|---|---|
| Month | Jan | Feb | Mar | Apr | May | Jun | Jul | Aug | Sep | Oct | Nov | Dec | Year |
| Record high °C (°F) | 37.4 (99.3) |
39.4 (102.9) |
41.1 (106.0) |
42.3 (108.1) |
41.3 (106.3) |
38.4 (101.1) |
37.8 (100.0) |
37.2 (99.0) |
36.5 (97.7) |
34.7 (94.5) |
36.6 (97.9) |
35.9 (96.6) |
42.3 (108.1) |
| Average high °C (°F) | 31.1 (88.0) |
33.3 (91.9) |
35.5 (95.9) |
36.5 (97.7) |
35.2 (95.4) |
34.0 (93.2) |
33.0 (91.4) |
32.5 (90.5) |
32.0 (89.6) |
31.6 (88.9) |
31.3 (88.3) |
30.3 (86.5) |
33.03 (91.45) |
| Daily mean °C (°F) | 24.1 (75.4) |
26.3 (79.3) |
28.9 (84.0) |
30.3 (86.5) |
29.7 (85.5) |
29.2 (84.6) |
28.6 (83.5) |
28.3 (82.9) |
27.9 (82.2) |
27.3 (81.1) |
26.0 (78.8) |
24.0 (75.2) |
27.55 (81.59) |
| Average low °C (°F) | 18.0 (64.4) |
20.1 (68.2) |
23.3 (73.9) |
25.1 (77.2) |
25.4 (77.7) |
25.3 (77.5) |
24.9 (76.8) |
24.7 (76.5) |
24.4 (75.9) |
23.4 (74.1) |
21.1 (70.0) |
18.5 (65.3) |
22.85 (73.13) |
| Record low °C (°F) | 9.6 (49.3) |
11.3 (52.3) |
11.4 (52.5) |
17.9 (64.2) |
20.3 (68.5) |
20.3 (68.5) |
21.6 (70.9) |
20.4 (68.7) |
20.3 (68.5) |
16.7 (62.1) |
13.2 (55.8) |
8.1 (46.6) |
8.1 (46.6) |
| Average precipitation mm (inches) | 8.4 (0.33) |
11.9 (0.47) |
42.9 (1.69) |
82.6 (3.25) |
168.3 (6.63) |
181.4 (7.14) |
219.6 (8.65) |
231.3 (9.11) |
254.5 (10.02) |
113.1 (4.45) |
19.0 (0.75) |
1.6 (0.06) |
1,334.6 (52.54) |
| Average precipitation days (≥ 1.0 mm) | 0.7 | 1.3 | 3.6 | 5.0 | 11.1 | 11.6 | 14.0 | 13.9 | 14.7 | 7.2 | 1.6 | 0.2 | 84.9 |
| Average relative humidity (%) | 69.5 | 66.2 | 64.7 | 66.6 | 74.1 | 76.7 | 79.0 | 80.8 | 83.1 | 79.5 | 74.0 | 70.7 | 73.7 |
| Source: World Meteorological Organization[1](extremes)[2] | |||||||||||||
References
- "World Meteorological Organization Climate Normals for 1991–2020". World Meteorological Organization. Retrieved 12 October 2023.
- "Climatological Data for the Period 1981–2010". Thai Meteorological Department. Retrieved 4 August 2016.
This article is issued from Wikipedia. The text is licensed under Creative Commons - Attribution - Sharealike. Additional terms may apply for the media files.