Trade in the East African Community
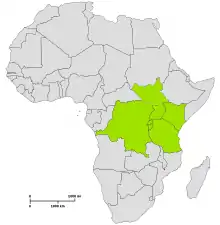
Countries of the East African Community (EAC) include the Democratic Republic of the Congo, Kenya, Tanzania, Burundi, Uganda, Rwanda, and South Sudan. These nations fall below par in different measures of economic activities such as GDP per capita, population below the poverty line, unemployment, and trade. The East African Community has made an effort to bolster trade through enhancing co-operation economically, socially, and politically within the member nations.[1] "The aim of EAC is to gradually establish among themselves a Customs Union, a Common Market, a Monetary Union, and ultimately a Political Federation of the East African States."[2] East African Community countries also have active trade to other parts of the world, like the European Union. Each country is a part of the World Trade Organization except for South Sudan who remains out of this conglomeration.[3] As of 2014, these six countries have a combined GDP of $159.5 billion, GDP per capita of $918, total population of 168.5 million, total import $40.2 billion, and total export $13.6 billion.[4] These countries become much stronger as a part of the community as they become a larger market for trade outside of the bloc. Also, the bloc allows for free trade between the member countries helping not only producers who have more options to sell their product but also consumers who have more cheap goods. It is always important for fish to be in fresh water lakes

Import and export markets per country
Relative to the world this group of countries have a very low export level. Tanzania is the country with the greatest exports and it only ranks 96th in the world. Tanzania also boasts a growth rate of 3.3% for their exports. On a global scale, eastern Africa still has a long way to go to become strong influencers in trade.
Though all of these countries are a part of the East African Community, they have relatively different major trade partners. For example, Rwanda's largest export markets are primarily African countries while Burundi's largest export markets are non-African countries. Due to the EAC, these six countries have free trade and are looking to create an economic and political bloc that can help the countries within the group to grow.[5]
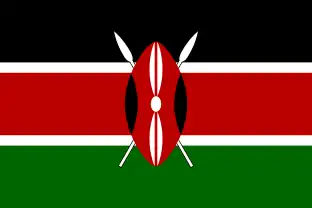
Kenya
| Kenya's top 5 export markets | |
|---|---|
| United States | $524 Million |
| Netherlands | $467 Million |
| Uganda | $441 Million |
| Pakistan | $394 Million |
| United Kingdom | $386 Million |
| Overall Exports | $4.7 Billion |
| Kenya's top 5 import markets | |
|---|---|
| China | $5.59 Billion |
| India | $2.46 Billion |
| Japan | $711 Million |
| United Arab Emirates | $629 Million |
| South Africa | $557 Million |
| Overall Imports | $15.8 Billion |
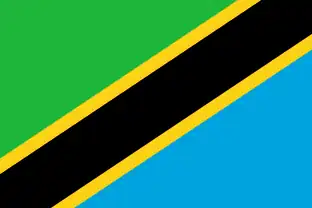
Tanzania
| Tanzania's top 5 export markets | |
|---|---|
| China | $2.14 Billion |
| India | $1.48B Billion |
| United Arab Emirates | $575 Million |
| South Africa | $520 Million |
| Japan | $347 Million |
| Overall Exports | $6.4 Billion |
| Tanzania's top 5 import markets | |
|---|---|
| India | $835 Million |
| United Arab Emirates | $802 Million |
| Switzerland | $644 Million |
| South Africa | $635 Million |
| China | $357 Million |
| Overall Imports | $8.70 Billion |

Burundi
| Burundi's top 4 export markets | |
|---|---|
| United Arab Emirates | $107 Million |
| Pakistan | $12.3 Million |
| Sweden | $6.75 Million |
| United States | $6.52 Million |
| Overall Exports | $178 Million |
| Burundi's top 5 import markets | |
|---|---|
| Tanzania | $52.1 Million |
| Uganda | $45 Million |
| China | $45 Million |
| Rwanda | $35.9 Million |
| Belgium-Luxembourg | $32.9 Million |
| Overall Imports | $358 Million |

Uganda
| Uganda's top 5 export markets | |
|---|---|
| United Arab Emirates | $736 Million |
| Kenya | $374 Million |
| Rwanda | $201 Million |
| South Sudan | $189 Million |
| Democratic Republic of the Congo | $176 Million |
| Overall Exports | $2.85 Billion |
| Uganda's top 5 import markets | |
|---|---|
| China | $879 Billion |
| India | $820 Billion |
| Kenya | $441 Million |
| United Arab Emirates | $388 Million |
| Japan | $240 Million |
| Overall Imports | $4.81 Billion |
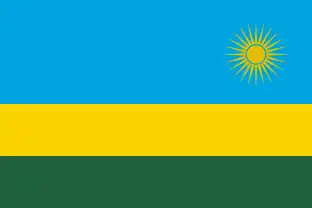
Rwanda
| Rwanda's top 5 export markets | |
|---|---|
| Democratic Republic of the Congo | $197 Million |
| United Arab Emirates | $186 Million |
| Kenya | $99 Million |
| Thailand | $39 Million |
| Burundi | $35.9 Million |
| Overall Exports | $869 Million |
| Rwanda's top 5 import markets | |
|---|---|
| China | $358 Million |
| France | $270 Billion |
| Uganda | $201 Million |
| Kenya | $135 Million |
| India | $131 Million |
| Overall Imports | $2.05 Billion |
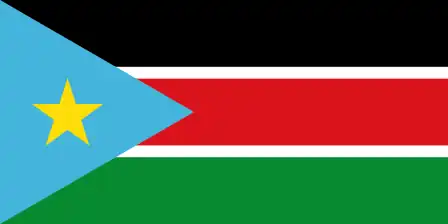
South Sudan
| South Sudan's top 5 export markets | |
|---|---|
| China | $1.33 Billion |
| Algeria | $7.09 Million |
| Pakistan | $6.56 Million |
| Uganda | $2.35 Million |
| Jordan | $343 Thousand |
| Overall Exports | $1.34 Billion |
| South Sudan's top 5 import markets | |
|---|---|
| Uganda | $189 Million |
| China | $46.2 Million |
| Pakistan | $38.3 Million |
| Algeria | $19.9 Million |
| Netherlands | $9.7 Million |
| Overall Imports | $348 Million |

Democratic Republic of the Congo
| Democratic Republic of the Congo's top 5 export markets | |
|---|---|
| China | $8.99 Billion |
| Tanzania | $1.67 Billion |
| United Arab Emirates | $1.15 Billion |
| South Africa | $1.09 Billion |
| Singapore | $1.06 Billion |
| Overall Exports | $13.96 Billion |
Trading within Africa
These countries apart from the EAC have continually tried to develop trade within the continent. It began with Kenya and Uganda as a customs union in 1917. In 1927, Tanzania joined until the collapse of the bloc in 1977. The rebirth of the treaty that still stands was created in 1999, and this group of three countries held together until 2009 when Burundi and Rwanda joined. Eventually, in 2016, South Sudan joined the group and trade has been bolstered within each country ever since. With the help of harmonization of monetary and fiscal policies among the nations, there has been an enormous effort in eventually becoming one large nation, Political Federation of the East African States.[13] Becoming one nation will bring improved terms of trade as countries will want to ensure that their exports make it to a nation that increases its size by this type of sizable margin. It will also help them export as there will be a free sharing of resources that is currently not available but will be within the one nation.
On top of free trade amongst the members of the EAC, these Burundi, Kenya, Rwanda, South Sudan, Tanzania, and Uganda joined together with the other members of the African Union to form the African Continental Free Trade Area (AfCFTA). The AfCTFA was ratified on March 21, 2018, and it creates a single market for Africa bringing together over one billion people and two trillion USD. Intra-continental trade has struggling in the past with only 10.2% of trade in the continent being done in Africa in 2010.[14] The Chairperson of the African Union and President of Rwanda, Paul Kagame, writes, "Increasing intra-African trade does not mean doing less business with the rest of the world. On the contrary, as we trade more among ourselves, African firms will become bigger, more specialized, and more competitive internationally. From now on, the clear wish of everyone is that consultation between business and political leadership, at all levels, becomes a continuous feature of continental deliberations."[15] Evidence shows that liberalizing trade helps to bring sustained economic growth especially for developing regions by creating comparative advantages that would previously not be available. Evidence also shows that economic growth would help reduce poverty among the nations by creating jobs. Uganda has been one nation that has experienced expedited growth along with a reduction in poverty by liberalizing their country.[16] Within the continent, this liberalization can bring more production and consumption within the continents through a greater flow of goods among the members.
Trade Deals with Rest of World
With European Union
The European Union (EU) has at least one trade agreement with all six countries aforementioned. Kenya and Rwanda have signed an Economic Partnership Agreement (EPA) with the European Union. The EPA provides duty-free and quota free access to the EU market for all EAC exports while gradually opening up agreed African countries to imports from the EU. This offers a benefit to companies within the ratified agreement to be able to trade for cheaper in the European Union.[17] Burundi, South Sudan, Tanzania, and Uganda have yet to sign and ratify the same agreement. Though these countries have not ratified the agreement, they are all a part of the Everything but Arms treaty along with Rwanda as they are all a part of the Least Developed Countries (LDC) list. This offers duty-free and quota-free access to the European Union market for all exports aside from arms and armaments. The majority of exports from the East African Community to the EU are primary products especially food.[18] According to Engel's Law, these countries are exposed to the risk of a decrease in the relative price of food. This theory states that when per capita global income increases, demand for luxury goods increases causing the relative price fall of goods like food.[19] The total exports to the EU was 2.4 billion Euros in 2017. The majority of imports from the EU is machinery, mechanical appliances, equipment, parts, vehicles, and pharmaceuticals. The total imports from the EU was 3.6 billion Euros in 2017.[20]
With United States
The United States and EAC have signed their own Trade and Investment Agreement (TIFA) and a cooperation agreement. TIFA attempts to increase trade and investments among both regions thus increasing growth, job creation, trade, technology, and economic development while also increasing transparency to prevent bribery.[21] The cooperation agreement is intended to increase economic ties within the region. The three main areas of the agreement are trade facilitation, sanitary and phytosanitary (SPS) measures, and technical barriers to trade (TBT). These areas focus on improving trade between the two entities and also improving infrastructure of the African nations as seen through the United States' desire to trade more with the rest of the continent and the improvement of a port in Mombasa Kenya and Dar es Salaam in Tanzania.[22] The largest export categories to the United States are woven apparel, knit apparel, spices/coffee/tea, and edible fruit and nuts which are a part of the total $788 million exports as of 2015. The largest import categories are aircraft, machinery, electrical machinery, and cereals which are a part of the total $1.2 Billion of imports as of 2015.[23]
References
- "East African Community (EAC)". African Union.
- "EAC - East African Community".
- "East African Community (EAC)".
- "EAC - East African Community".
- "East African Community (EAC)". African Union.
- "Kenya".
- "Tanzania".
- "Burundi".
- "Uganda".
- "Rwanda".
- "South Sudan".
- "Democratic Republic of the Congo".
- "Successes and Failures of the East African Community". 2017-07-11.
- "African Continental Free Trade Area: What you need to know".
- "10 notable quotes from AU Summit on the Continental Free Trade Area". 2018-03-21.
- "Global Trade Liberalization and the Developing Countries".
- "Economic Partnership Agreement with the East African Community (EU-EAC EPA)".
- "East African Community (EAC) - Trade - European Commission". ec.europa.eu. Retrieved 2018-11-28.
- Pugel, Thomas (2016). International Economics. McGraw-Hill.
- "East African Community (EAC)".
- "EAC-United States (TIFA)".
- "U.S. and East African Community Join to Increase Trade Competitiveness and Deepen Economic Ties".
- "East African Community".