2012–13 Australian region cyclone season
The 2012–13 Australian region cyclone season was a slightly below average tropical cyclone season event in the ongoing cycle of tropical cyclone formation. It officially started on 1 November 2012, and officially ended on 30 April 2013, despite Cyclone Zane being an active system at the time (it dissipated a day later on 1 May). The regional tropical cyclone operational plan defines a "tropical cyclone year" separately from a "tropical cyclone season"; the "tropical cyclone year" began on 1 July 2012 and ended on 30 June 2013.[1]
| 2012–13 Australian region cyclone season | |
|---|---|
 Season summary map | |
| Seasonal boundaries | |
| First system formed | 18 December 2012 |
| Last system dissipated | 2 May 2013 |
| Strongest storm | |
| Name | Narelle |
| • Maximum winds | 195 km/h (120 mph) (10-minute sustained) |
| • Lowest pressure | 930 hPa (mbar) |
| Seasonal statistics | |
| Tropical lows | 16 |
| Tropical cyclones | 9 |
| Severe tropical cyclones | 6 |
| Total fatalities | 20 total |
| Total damage | $3.03 billion (2013 USD) |
| Related articles | |
The scope of the Australian region is limited to all areas south of the equator, east of 90°E and west of 160°E. This area includes Australia, Papua New Guinea, western parts of the Solomon Islands, East Timor and southern parts of Indonesia. Tropical cyclones in this area are monitored by five Tropical Cyclone Warning Centres (TCWCs): the Australian Bureau of Meteorology in Perth, Darwin, and Brisbane; TCWC Jakarta in Indonesia; and TCWC Port Moresby in Papua New Guinea.[1] The Joint Typhoon Warning Center issues unofficial warnings for the region, designating tropical depressions with the "S" suffix when they form west of 145°E, and the "P" suffix when they form east of 145°E.
Seasonal forecasts
| Region | Chance of above average |
Average number |
Actual activity | |
|---|---|---|---|---|
| Whole | 37% | 11 | 10 | |
| Western | 43% | 7 | 5 | |
| North-Western | 42% | 5 | 5 | |
| Northern | 48% | 3 | 2 | |
| Eastern | 43% | 3 | 4 | |
| Southern Pacific | 53% | 15 | 5 | |
| Western South Pacific | 35% | 8 | 4 | |
| Eastern South Pacific | 55% | 11 | 3 | |
| Source:BOM's Seasonal Outlooks for Tropical Cyclones.[2][3] | ||||
| Region | Normal number |
Number predicted |
Actual activity | |
| GCACIC Whole | 12 – 15 | 12 | 10/11 | |
| GCACIC Western | 9 – 10 | 9 | 6 | |
| GCACIC Eastern | 5 – 6 | 4 | 5 | |
| NIWA | 10 | 9 – 10 | 8 | |
| Sources:[4][5][6] | ||||
During each tropical cyclone year, Australia's Bureau of Meteorology National Climate Centre (BoM), the Guy Carpenter Asia-Pacific Climate Impact Centre, New Zealand's National Institute of Water and Atmospheric Research (NIWA) and partners issue seasonal forecasts for the Australian region and its various subregions. Since a tropical cyclone can move through a region, the actual number of tropical cyclones in a region include any that form in or move into a region from another.
Bureau of Meteorology
In October 2012, ahead of the season starting on 1 November, the BoM issued seasonal forecasts for the whole Australian region, one for each of the subregions Western, North-Western, Northern and Eastern Australia with each one covering the whole tropical cyclone year.[2] For each forecast they took into account, the current neutral ENSO conditions and the near El Niño conditions that had been observed during that summer.[2] For the whole region they predicted that the season would be below average, with a 63% chance that it would be below average and a 37% chance that it would be above average.[2] For the Western region between 90°E and 125°E, the BoM forecast that the area would see activity near to or slightly below the average, with a 43% chance of a below average cyclone activity.[2] For the North-Western subregion between 105°E and 130°E, it was predicted that there was a 58% chance of below average tropical cyclone activity, while TCWC Perth noted that there was a likelihood of two tropical cyclones and one severe tropical cyclone impacting Western Australia.[7] There was no tendency towards an above or below average tropical cyclone season for the Northern Territory which was defined as being between as being 125°E and 142.5°E, while the Eastern region had a 57% chance of having a below average tropical cyclone season.[2]
The BoM also issued seasonal forecasts for the South Pacific region between 142.5°E and 120°W, one for the Western Southern Pacific region between 142.5°E and 165°E and one for the Eastern Southern Pacific region between 165°E and 120°W.[3] They noted that the current neutral ENSO conditions would historically suggest the South Pacific region as a whole would experience near average tropical cyclone activity during the coming season.[3] However, because of the warmer than average sea surface temperatures that were experienced in the central equatorial Pacific during July, August and September 2012, the western Southern Pacific had a 65% chance for average to below average tropical cyclone activity.[3] For the Eastern part of the region the BoM predicted that it had a 55% chance of above average tropical cyclones, while for the overall region, they predicted that the region would experience a near average amount of tropical cyclones with a 53% chance of having an above average number of tropical cyclones.[3]
Others
During October 2012, the New Zealand National Institute of Water and Atmospheric Research (NIWA) and its partners issued a tropical cyclone outlook, for the South Pacific region between 135°E and 120°W.[4] The outlook predicted that the region would see a near average or slightly above average amount of tropical cyclones with between 9 and 12 systems predicted to develop or move into the region.[4] NIWA also predicted that countries west of the International Date Line, including Papua New Guinea, the Solomon Islands, Vanuatu, New Caledonia and Fiji were likely to experience an average to slightly above normal risk of a tropical cyclone.[4]
During December 2012, the Guy Carpenter Asia-Pacific Climate Impact Centre (GCACIC), issued a seasonal forecast for the whole basin and one each for the regions to the east and west of 135°E.[5] This season the GCACIC predicted that tropical cyclone activity in the entire Australian region and the western Australian region was likely to be near-normal and predicted 12 and 9 tropical cyclone respectively.[5] For the eastern Australian region, the GCAIC predicted that tropical cyclone activity would be below average and only predicted 4 tropical cyclones to develop.[5]
Seasonal summary

Systems
Tropical Cyclone Mitchell
| Category 1 tropical cyclone (Australian scale) | |
| Tropical storm (SSHWS) | |
  | |
| Duration | 28 December – 1 January |
|---|---|
| Peak intensity | 85 km/h (50 mph) (10-min); 988 hPa (mbar) |
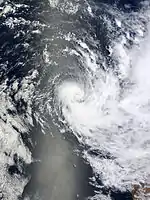
On 27 December, Tropical Low 04U developed within a monsoon trough about 805 km (500 mi) north-northwest of Karratha.[8] The following day, a significant central dense overcast developed over the low and banding features began forming to the northwest of the center.[9] Development was further aided by an anticyclone situated just to the east, providing dual outflow channels.[10] Later on 28 December, the JTWC classified the system as a tropical storm as the banding features consolidated around the low's center and a scatterometer pass revealed winds of 55 to 65 km/h (35 to 40 mph). Some intensification was expected as the storm tracked generally southward along the edge of a subtropical ridge before moving over cooler waters.[11] On 29 December, TCWC Perth classified the system as Tropical Cyclone Mitchell, the first named storm in the western region for the season. The storm ultimately attained peak winds of 75 km/h (45 mph) and a pressure of 990 mb (hPa; 29.23 inHg) before weakening below tropical cyclone strength on 30 December. The system persisted for two more days off the coast of Western Australia before dissipating well to the west of Perth on 1 January 2013.[8]
Severe Tropical Cyclone Narelle
| Category 4 severe tropical cyclone (Australian scale) | |
| Category 4 tropical cyclone (SSHWS) | |
  | |
| Duration | 5 January – 15 January |
|---|---|
| Peak intensity | 195 km/h (120 mph) (10-min); 930 hPa (mbar) |
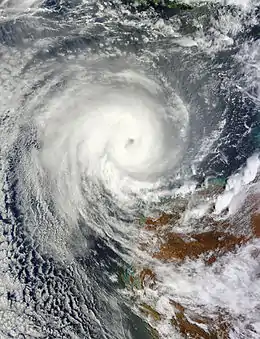
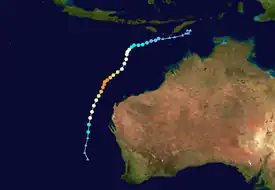
On 4 January, a tropical low developed within a monsoon trough over the Timor Sea.[12] Over the following several days, the system gradually tracked westward and intensified, being classified Tropical Cyclone Narelle on 8 January.[13] Turning southward into a region of low wind shear,[14] Narelle intensified into a severe tropical cyclone on 9 January.[13] Over the following two days, the cyclone's structure fluctuated, temporarily featuring an eye, before it maintained its organization and intensified further on 11 January.[15] The storm attained its peak intensity later on 11 January as a Category 4 cyclone with winds of 195 km/h (120 mph).[16] Around the same time, the JTWC assessed Narelle to have been a Category 4-equivalent storm on the Saffir–Simpson hurricane scale with winds of 215 km/h (135 mph).[17] The following day, Narelle passed approximately 330 km (205 mi) northwest of Exmouth as it moved on a south-southwesterly course. The system steadily weakened and ultimately fell below tropical cyclone strength on 15 January well to the west of Geraldton.[13]
Early in the storm's existence, Narelle brought strong winds, heavy rain, and high winds to many areas in Indonesia. More than 10,000 homes were flooded and many others were damaged by thunderstorms.[18][19] A total of 14 people were killed by the storm, and 17 others were listed as missing.[20][21] In Western Australia, scattered strong thunderstorms caused minor damage and produced a possible tornado.[22][23] Moisture from the storm spread into South Australia, producing light rain and bringing relief to areas suffering from a severe drought.[24]
Tropical Low 06U
| Tropical low (Australian scale) | |
  | |
| Duration | 12 January – 16 January |
|---|---|
| Peak intensity | Winds not specified; 1004 hPa (mbar) |
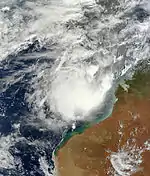
On 12 January, a weak tropical low formed over the Arafura Sea.[25] The system was last noted the following day, having a pressure no lower than 1004 mb (hPa; 29.65 inHg).[26] The United States Navy continued monitoring the system until it was last noted on 16 January.[27]
Tropical Cyclone Oswald
| Category 1 tropical cyclone (Australian scale) | |
| Tropical storm (SSHWS) | |
  | |
| Duration | 17 January – 28 January |
|---|---|
| Peak intensity | 65 km/h (40 mph) (10-min); 991 hPa (mbar) |
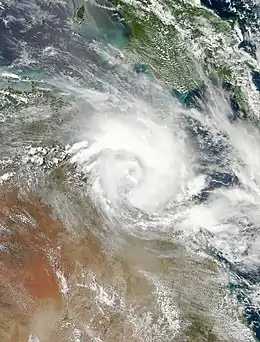
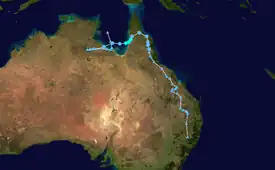
On 17 January, an area of low pressure developed over the Gulf of Carpentaria. Situated within a region of low wind shear and high sea surface temperatures, conditions were favorable for gradual development of the system.[28] The following day, TCWC Darwin began monitoring the system as a tropical low.[29] Early on 19 January, the system made landfall southwest of Borroloola.[30] By 20 January, the system completed a clockwise loop before re-emerging into the Gulf of Carpentaria.[31] Once back over water, the system quickly organized and strengthened into a tropical cyclone early on 21 January.[32] Radar imagery from Mornington Island depicted a well-defined low-level circulation with defined banding features wrapping into the center. Situated in a very moist air mass and over the warm waters of the Gulf, some intensification was expected before Oswald struck the Cape York Peninsula.[33] Approximately 12 hours after being named, the storm made its second landfall north of Kowanyama with winds of 65 km/h (40 mph) and the final advisory was issued by TCWC Brisbane.[34] Although over land, the system was able to maintain a defined circulation and gradually reorganized as it moved southwestward. By 23 January, deep convection redeveloped over the circulation and a strong monsoonal flow became established to its north.[35]
Although a relatively weak storm, Oswald produced torrential rains over much of Queensland. Rainfall peaked in Tully where approximately 1,000 mm (39 in) of rain fell, with 632 mm (24.9 in) falling over a 48‑hour span. The township of Scherger received a record-breaking 370 mm (15 in) in just 24 hours. These rains caused widespread flooding in the state that shut down many roads and isolated communities. The town of Ingham was completely cut off due to high waters. Residents in the town were advised to stock up on emergency supplies as the Herbert River rose rapidly after 200 mm (7.9 in) of rain fell in the town in just three hours. In Cairns, winds up to 90 km/h (56 mph) left many homes without power and waves up to 4 m (13 ft) prompted the cancellation of most coastal activities. Additionally, a brief tornado or waterspout with winds of 140 km/h (87 mph) touched down near Hay Point.[36] Across the affected region, damage from severe weather and flooding amounted to at least A$2.4 billion (US$2.5 billion).[37] The name Oswald was retired and was replaced with Oran.
Tropical Low Peta
| Tropical low (Australian scale) | |
| Tropical storm (SSHWS) | |
  | |
| Duration | 20 January – 23 January |
|---|---|
| Peak intensity | 85 km/h (50 mph) (10-min); 988 hPa (mbar) |
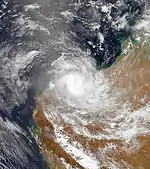
On 20 January, a weak low formed over the Kimberley region of Western Australia.[38] Partially overland, convection persisted mainly on the western half of the low as it took in moisture from the Indian Ocean.[39] Tracking west-southwestward in response to a weak mid-level ridge to the southeast, the system gradually intensified and was designated as Tropical Low 08U later on 21 January by TCWC Perth as it moved offshore.[38][40] Throughout the day, radar imagery from Broome depicted increasing banding features around the low. Following further convective development of the storm, the JTWC issued a TCFA late on 21 January.[41] Approximately 24 hours later, the JTWC followed up on this alert with the first advisory on Tropical Cyclone 12S, classifying it as a tropical depression.[42] Early on 23 January, surface observations from Cape Lambert and Roebourne indicated that the low had attained gale-force winds, prompting TCWC Perth to upgrade the system to Tropical Cyclone Peta; however, the system may not have met the technical definition of a tropical cyclone as gales did not extend more than halfway around the circulation.[43] Upon being named, Peta had turned due south and subsequently made landfall near Point Samson with winds of 75 km/h (45 mph).[38] Hours after moving onshore, Peta rapidly weakened and the final advisory was issued during the afternoon of 23 January.[44]
On 22 January, Port Hedland shut down all shipping.[45] Across much of western Pilbara, Peta dropped heavy rains that caused widespread flooding. The highest 24‑hour total 261.6 mm (10.30 in) at Hooley Station, which marked the station's highest daily total since 1972. Several other areas recorded more than 100 mm (3.9 in) of rain from the cyclone, including Port Hedland. The rains also added 28 billion litres (7.4 billion gallons) at the Harding Dam, raising its storage from 40 to 80 percent. Flooding prompted officials to shut down parts of the Great Northern Highway.[46]
Severe Tropical Cyclone Rusty
| Category 4 severe tropical cyclone (Australian scale) | |
| Category 3 tropical cyclone (SSHWS) | |
  | |
| Duration | 18 February – 28 February |
|---|---|
| Peak intensity | 165 km/h (105 mph) (10-min); 944 hPa (mbar) |
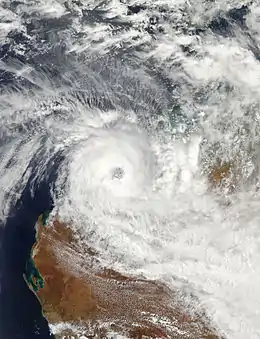
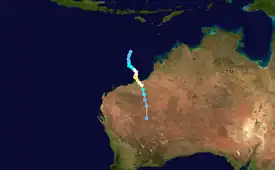
On 22 February, a tropical low formed northwest of Kuri Bay. Two days later, the low reached Tropical Cyclone strength and was named Rusty as it moved very slowly south towards the coast of Western Australia. A cyclone watch was declared for a large area of the Pilbara/Kimberley coastline between Broome and Mardie extending inland to Marble Bar. Rusty remained relatively stationary off the Western Australian coastline,[47] reaching category 4 strength on 27 February with winds gusting to 230 km/h.[48] Rusty made landfall on 27 February near Pardoo, 100 km East of Port Hedland. Due to the slow-moving nature of the cyclone, Port Hedland experienced 39 hours of winds of at least gale-force strength (with the maximum gust of 119 km/h), something not seen since 1942. The highest rainfall was recorded at Pardoo Station with an unconfirmed total of 482.5 mm. Confirmed falls of over 300 mm were also reported at De Grey Station and at Yarrie mine.[49]
The effects of Rusty were far reaching (paralleling Cyclone Lua almost a year ago), with areas of Southern WA and the Goldfields experiencing heavy rains. For example, the city of Kalgoorlie-Boulder and the surrounding areas have had non-stop rains for over 15 hours, with totals amounting to about 88 mm for the city itself.
Tropical Low 11U
| Tropical low (Australian scale) | |
| Tropical storm (SSHWS) | |
  | |
| Duration | 22 February – 28 February |
|---|---|
| Peak intensity | 55 km/h (35 mph) (10-min); 995 hPa (mbar) |
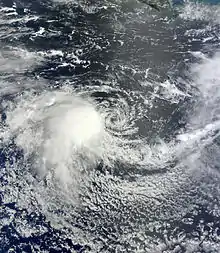
Early on 22 February, TCWC Perth started to monitor Tropical Low 11U, that had formed within the Indian Ocean, about 500 km (310 mi) to the east-southeast of Cocos Island. Over the next few days the low moved slowly towards the northwest and then to the south and passed about 120 km (75 mi) to the east of Cocos Island.
Situated near the Cocos Islands for a prolonged period of time, the low produced record-breaking rains across the island. Between 23 and 25 February, 844.6 mm (33.25 in) of rain fell on the island, of which 416 mm (16.4 in) fell on 25 February. This greatly contributed to the island breaking its monthly rainfall record, with 1,000.4 mm (39.39 in) being measured during February.[50] Significant flooding took place as a result of the rains, especially on Home Island where some people called the floods the worst in 100 years. The Cocos (Keeling) Islands Airport was also temporarily shut down due to "bubbling" on the airstrip.[51] Gale-force winds associated with the system downed several trees and cut power to many homes across Home and West Island.[50][51]
Severe Tropical Cyclone Sandra
| Category 3 severe tropical cyclone (Australian scale) | |
| Category 1 tropical cyclone (SSHWS) | |
  | |
| Duration | 5 March – 9 March (Exited basin) |
|---|---|
| Peak intensity | 150 km/h (90 mph) (10-min); 963 hPa (mbar) |
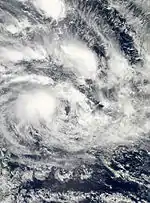
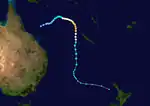
A tropical low formed on 5 March in the Queensland region, and was named 19P by the JTWC. The low was renamed Sandra on 8 March as it rapidly intensified in the Coral Sea. It then moved into the South Pacific region as a Category 3 system. Upon reaching Category 4 and threatening New Caledonia, it hit Lord Howe Island as a Category 2 storm on 15 March, despite weakening to Category 1 the day before.[52] The remnants of Sandra bought areas of heavy rain and thunderstorms to drought-stricken parts of New Zealand, with reports of up to 112 millimetres (4.4 in) at Turakina near Whanganui and a tornado in New Plymouth.
Tropical Cyclone Tim
| Category 2 tropical cyclone (Australian scale) | |
| Tropical storm (SSHWS) | |
  | |
| Duration | 10 March – 20 March |
|---|---|
| Peak intensity | 95 km/h (60 mph) (10-min); 985 hPa (mbar) |
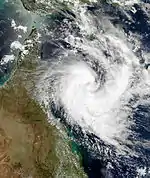
On 10 March 2013, the JTWC started tracking a tropical low approximately 426 km (265 mi) west south-west of the tip of Cape York Peninsula in the Gulf of Carpentaria. As the system began to move north-east, a subtropical ridge located to the south provided a good outflow channel, while vertical windshear continued to improve in the area. By 12 March, the JTWC upgraded the low's chance of developing into a tropical cyclone over the next 24 hours to medium. On 13 March, banding features began to wrap around the lows center, and the JTWC warned the system had a high chance of forming into a tropical cyclone over the next 24 hours, as it continued to move north-east.[53] Early on 14 March, the tropical low crossed Cape York and moved into the northern Coral Sea, encountering an area of warmer sea surface temperatures and high windshear. At 10:25am EST, the TCWC Brisbane named the storm Tropical Cyclone Tim, as it intensified into a Category 1 storm with 10-minute wind speeds of 65 km (40 mi). Located approximately 440 km (275 mi) north-east of Cairns, Tropical Cyclone Tim began to move in an east south-easterly direction towards Willis Island. It passed directly over the island, where the automated weather station recorded 10-minute wind gusts of 75 km (45 mi) before the station stopped recording.[54] By late on 14 March, Tim rapidly intensified into a Category 2 storm on the Australian Scale, with maximum 10-minute wind gusts of 95 km (60 mi) and a barometric pressure of 985 hPa, equal to a Tropical Storm on the Saffir–Simpson hurricane scale.
By 15 March, Tim began to swing towards the south-east, rather than continue its south-westerly track, and was expected to make landfall on the Queensland as a weak Category 1 or Tropical Low by 19 March. A pocket of dry air formed to the west of the storm, and caused Tim to rapidly weaken, falling back to a Category 1 Tropical Cyclone on 15 March.[55] However, the storm managed to maintain its strength until 17 March, when the dry air finally began to erode Tims core and the Bureau of Meteorology reported that it weakened into a Tropical Low late on 17 March. The low persisted for several days in the eastern Coral Sea, moving north-west along the Queensland coast, and on 20 March, it dissipated 102 km (65 mi) east north-east of Cardwell on the north Queensland Coast. The remnants of the system crossed the coast near Innisfail on 21 March, bringing light winds and showers, however no significant totals were recorded, apart from an isolated fall of 125.8 mm (5 in) of rain at Innisfail.[56] Minor damage was also sustained at the Willis Island Weather station, however it was repaired shortly after Tim's passage over the island.
Tropical Low 15U
| Tropical low (Australian scale) | |
  | |
| Duration | 17 March – 23 March |
|---|---|
| Peak intensity | 65 km/h (40 mph) (10-min); 1000 hPa (mbar) |
A weak tropical low formed near the Cocos Islands on 17 March and moved south-west without any further intensification.
Tropical Low 16U
| Tropical low (Australian scale) | |
  | |
| Duration | 24 March – 31 March |
|---|---|
| Peak intensity | Winds not specified; 1003 hPa (mbar) |
On 1 April, heavy rains, peaking at 187 mm (7.4 in) in Edith Farms Road, over the Katherine Region triggered localised flooding. Several roads were temporarily closed as rivers rose up to 4 m (13 ft) overnight; however, waters receded later that day.[57]
Severe Tropical Cyclone Victoria
| Category 3 severe tropical cyclone (Australian scale) | |
| Category 1 tropical cyclone (SSHWS) | |
  | |
| Duration | 7 April – 12 April |
|---|---|
| Peak intensity | 140 km/h (85 mph) (10-min); 971 hPa (mbar) |
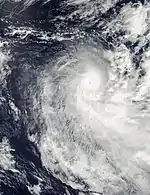
On 6 April, TCWC Perth started to monitor a weak tropical low 17U that had developed within TCWC Jakarta's area of responsibility, about 740 km (460 mi) to the north-northeast of the Cocos Islands.[58] Over the next two days, the system moved towards the south-southeast and slightly developed further, before it entered TCWC Perth's area of responsibility during 9 April. By the morning of 10 April, Victoria had intensified into a Category 3 severe tropical cyclone on the Australian Scale, as it moved south-southeast. However, Victoria began to weaken rapidly as it moved over an area of cool sea surface temperatures and weakened to a category 1 by 11 April. Late on 12 April, the system rapidly dissipated, without affecting the Australian mainland. The remnants of Victoria bought a bit of rain in Perth.[59]
Severe Tropical Cyclone Zane
| Category 3 severe tropical cyclone (Australian scale) | |
| Category 1 tropical cyclone (SSHWS) | |
  | |
| Duration | 27 April – 2 May |
|---|---|
| Peak intensity | 120 km/h (75 mph) (10-min); 981 hPa (mbar) |
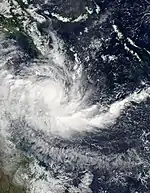
On 27 April, the TCWC Brisbane reported that a tropical low had formed 700 km (435 mi) east-southeast of Port Moresby, Papua New Guinea. Late on 29 April it was upgraded to Category 1 Tropical Cyclone Zane, as it headed towards the coast of Queensland.[60] A cyclone watch was issued for the Queensland coast between Thursday Island and Cooktown by the Bureau of Meteorology as Zane began to intensify.[61] On 30 April, the watch was upgraded to a warning for the whole of Cape York peninsula, as Zane rapidly intensified, reaching Category 2 on the Australian scale late on 30 April, while moving south-west toward the Queensland coast.[62] Initially forecast to reach Category 3, Zane began to deteriorate as it moved north-west, and began to dissipate rapidly, dropping from Category 2 to a Tropical Low in less than 24 hours. Late on 2 May, the remnant low crossed the coast near Lockhart River, causing minimal rain of less than 25 mm (5 cm) in the Torres Strait.[63]
Zane was shown to have reached marginal Category 3 severe tropical cyclone status in the best track data post-analysis of the storm, with sustained winds of 120 km/h (75 mph).[64]
Other systems
During 29 December, Tropical Cyclone Freda briefly moved into the basin from the South Pacific basin, as a Category 2 tropical cyclone with winds of 100 km/h (60 mph).[64]
Storm names
During the season a total of 9 tropical cyclones received a name from BoM, either by TCWC Perth, Darwin, or Brisbane, when the system was judged to have 10-minute sustained windspeeds of 65 km/h (40 mph). There has only been one list that the Bureau of Meteorology have assigned names to tropical cyclones since the 2008–09 season. Tropical cyclones named by the TCWC Jakarta and Port Moresby are rare, with the last named cyclones occurring during 2010 and 2007, respectively.
|
Season effects
This is a table of all of the storms that have formed in the 2012–13 Australian region cyclone season. It includes their duration, names, landfall(s)–denoted by bold location names – damages, and death totals. Damage and deaths include totals while the storm was extratropical, a wave, or a low, and all of the damage figures are in 2013 AUD and USD.
| Name | Dates | Peak intensity | Areas affected | Damages (AU$) |
Damages (US$) |
Deaths | |||
|---|---|---|---|---|---|---|---|---|---|
| Category | Wind speed (km/h (mph)) |
Pressure (hPa) | |||||||
| Tropical Low | 18–21 December | Tropical low | Not specified | Not specified | None | None | None | None | |
| Freda | 28 – 29 December 2012 | Category 3 severe tropical cyclone | 150 km/h (90 mph) | 964 hPa (28.47 inHg) | Solomon Islands, New Caledonia | Unknown | Unknown | [65] | |
| Mitchell | 27 December – 1 January | Category 1 tropical cyclone | 85 km/h (50 mph) | 988 hPa (29.18 inHg) | None | None | None | None | |
| Narelle | 5–15 January | Category 4 severe tropical cyclone | 195 km/h (120 mph) | 930 hPa (27.46 inHg) | East Timor, Indonesia, Western Australia, South Australia, Tasmania | $70,000 | $74,000 | 14 | |
| 06U | 12–16 January | Tropical low | Not specified | 1,004 hPa (29.65 inHg) | None | None | None | None | |
| Oswald | 17 – 29 January | Category 1 tropical cyclone | 65 km/h (40 mph) | 991 hPa (29.26 inHg) | Queensland, New South Wales | $2.4 billion | $2.52 billion | 6 | |
| Peta | 20 – 23 January | Tropical low | 85 km/h (50 mph) | 988 hPa (29.18 inHg) | Western Australia | Minor | Minor | None | |
| Tropical Low | 30–31 January | Tropical low | Not specified | Not specified | None | None | None | None | |
| Tropical Low | 6–10 February | Tropical low | Not specified | Not specified | None | None | None | None | |
| Rusty | 22–28 February | Category 4 severe tropical cyclone | 165 km/h (105 mph) | 944 hPa (27.88 inHg) | Western Australia, South Australia | $500 million | $510 million | None | |
| 11U | 22–28 February | Tropical low | 55 km/h (35 mph) | 995 hPa (29.38 inHg) | Cocos (Keeling) Island | None | None | None | |
| Sandra | 5–9 March | Category 3 severe tropical cyclone | 150 km/h (95 mph) | 963 hPa (28.44 inHg) | None | None | None | None | |
| Tim | 12 – 20 March 2013 | Category 2 tropical cyclone | 95 km/h (60 mph) | 985 hPa (29.09 inHg) | Cape York Peninsula | Unknown | Unknown | [66] | |
| 15U | 17–23 March | Tropical low | 65 km/h (40 mph) | 1,000 hPa (29.53 inHg) | None | None | None | None | |
| 16U | 25 March – 2 April | Tropical low | Not specified | 1,003 hPa (29.62 inHg) | Northern Territory | None | None | None | |
| Victoria | 7–12 April | Category 3 severe tropical cyclone | 140 km/h (85 mph) | 971 hPa (28.67 inHg) | Western Australia | None | None | None | |
| Tropical Low | 10–15 April | Tropical low | Not specified | 1,006 hPa (29.71 inHg) | None | None | None | None | |
| Zane | 27 April – 1 May | Category 3 severe tropical cyclone | 120 km/h (75 mph) | 983 hPa (29.03 inHg) | Papua New Guinea, Queensland | None | None | None | |
| Tropical Low | 14 May | Tropical low | Not specified | 1,007 hPa (29.74 inHg) | None | None | None | None | |
| Tropical Low | 19–25 June | Tropical low | Not specified | 1,000 hPa (29.53 inHg) | None | None | None | None | |
| Season aggregates | |||||||||
| 20 systems | 18 December – 25 June | 185 km/h (115 mph) | 930 hPa (27.46 inHg) | $3.03 billion | 20 | ||||
See also
- Tropical cyclones in 2012 and 2013
- Australian region tropical cyclone
- List of Southern Hemisphere tropical cyclone seasons
- Atlantic hurricane seasons: 2012, 2013
- Pacific hurricane seasons: 2012, 2013
- Pacific typhoon seasons: 2012, 2013
- North Indian Ocean cyclone seasons: 2012, 2013
- 2012–13 South-West Indian Ocean cyclone season
- 2012–13 South Pacific cyclone season
References
- "Tropical Cyclone Operational plan for the South Pacific & Southeast indian Ocean, 2010 Edition" (PDF). WMO. Retrieved 7 June 2012.
- National Climate Centre (15 October 2012). "2012–2013 Australian Tropical Cyclone Season Outlook". Australian Bureau of Meteorology. Archived from the original on 16 January 2013. Retrieved 7 January 2013.
- National Climate Centre (15 October 2012). "2012–2013 South Pacific Tropical Cyclone Season Outlook". Australian Bureau of Meteorology. Archived from the original on 14 October 2013. Retrieved 12 October 2013.
- "Southwest Pacific Tropical Cyclone Outlook: Near average or slightly above average numbers for many islands likely, and increased activity in the late season near Tonga and Niue". National Institute of Water & Atmospheric Research. 18 October 2012. Archived from the original on 22 January 2013. Retrieved 8 January 2013.
- Guy Carpenter Asia-Pacific Climate Impact Centre (3 December 2012). "2012–13 Predictions of Seasonal Tropical Cyclone Activity in the Australian region" (PDF). City University of Hong Kong. Retrieved 7 January 2013.
- Guy Carpenter Asia-Pacific Climate Impact Centre (19 August 2013). "Verification of Forecasts of Tropical Cyclone Activity in the Australian region in 2012/13" (PDF). City University of Hong Kong. Retrieved 19 August 2013.
- Perth Tropical Cyclone Warning Centre (15 October 2012). "Western Australia Seasonal Tropical Cyclone Outlook". Australian Bureau of Meteorology. Archived from the original on 1 January 2013. Retrieved 7 January 2013.
- "Tropical Cyclone Mitchell". Australian Bureau of Meteorology. 2013. Retrieved 24 January 2013.
- Joint Typhoon Warning Center (28 December 2012). "Significant Tropical Weather Outlook for the Indian Ocean". United States Navy. Archived from the original on 28 December 2012. Retrieved 24 January 2013.
- Joint Typhoon Warning Center (28 December 2012). "Tropical Cyclone Formation Alert". United States Navy. Archived from the original on 20 September 2012. Retrieved 24 January 2013.
- Joint Typhoon Warning Center (28 December 2012). "Tropical Cyclone 06S (Six) Advisory NR 001". United States Navy. Archived from the original on 29 December 2012. Retrieved 24 January 2013.
- Darwin Regional Forecasting Centre (4 January 2013). "Tropical Cyclone 3-day Outlook for Northern Region, including the Gulf of Carpentaria". Australian Bureau of Meteorology. Archived from the original on 6 January 2013. Retrieved 23 January 2013.
- "Severe Tropical Cyclone Narelle". Australian Bureau of Meteorology. 2013. Retrieved 23 January 2013.
- Darwin Tropical Cyclone Warning Centre (8 January 2013). "Tropical Cyclone Narelle Tropical Cyclone Technical Bulletin". Australian Bureau of Meteorology. Archived from the original on 9 January 2013. Retrieved 24 January 2013.
- Perth Tropical Cyclone Warning Centre (9 January 2013). "Severe Tropical Cyclone Narelle Tropical Cyclone Technical Bulletin". Australian Bureau of Meteorology. Archived from the original on 10 January 2013. Retrieved 24 January 2013.
- Meteorology, corporateName=Bureau of. "Tropical Cyclones". bom.gov.au. Retrieved 9 August 2017.
- Joint Typhoon Warning Center (11 January 2013). "Tropical Cyclone 08S (Narelle) Warning NR 016". United States Navy. Archived from the original on 12 January 2013. Retrieved 24 January 2013.
- Luh De Suriyani (10 January 2013). "Narelle tropical cyclone batters Bali with strong winds". The Jakarta Post. Archived from the original on 23 January 2013. Retrieved 16 January 2013.
- Multa Fidrus (11 January 2013). "Flood cuts off toll road, kills 4 in Banten". The Jakarta Post. Archived from the original on 12 January 2013. Retrieved 16 January 2013.
- Andi Hajramurni (16 January 2013). "Sunken ship search called off as bad weather continues". The Jakarta Post. Archived from the original on 18 January 2013. Retrieved 16 January 2013.
- "14 People Killed, 6 Missing in Natural Disasters in Indonesia This Year". Bernama. 10 January 2013. Archived from the original on 13 March 2013. Retrieved 16 January 2013.
- Elle Farcic (16 January 2013). "Storm rips off roofs in Wheatbelt". The West Australian. Archived from the original on 23 January 2013. Retrieved 16 January 2013.
- Phoebe Wearne (16 January 2013). "City sweats in cyclone's wake". The West Australian. Archived from the original on 23 January 2013. Retrieved 16 January 2013.
- Nigel Austin (13 January 2013). "Rain gives brief respite to heat-struck South Australia". The Advertiser. Adelaide. Archived from the original on 21 February 2017. Retrieved 16 January 2013.
- Darwin Tropical Cyclone Warning Centre (12 January 2013). "Tropical Cyclone 3-day Outlook for Northern Region, including the Gulf of Carpentaria". Australian Bureau of Meteorology. Archived from the original on 13 January 2013. Retrieved 24 January 2013.
- Darwin Tropical Cyclone Warning Centre (13 January 2013). "Tropical Cyclone 3-day Outlook for Northern Region, including the Gulf of Carpentaria". Australian Bureau of Meteorology. Archived from the original on 13 January 2013. Retrieved 24 January 2013.
- "Invest 90S Operational Best Track". United States Navy. 16 January 2013. Archived from the original on 3 January 2018. Retrieved 24 January 2013.
- Joint Typhoon Warning Center (17 January 2013). "Significant Tropical Weather Outlook for the Western and South Pacific Oceans". United States Navy. Archived from the original on 18 January 2013. Retrieved 24 January 2013.
- Darwin Tropical Cyclone Warning Centre (18 January 2013). "Tropical Cyclone 3-day Outlook for Northern Region, including the Gulf of Carpentaria". Australian Bureau of Meteorology. Archived from the original on 18 January 2013. Retrieved 24 January 2013.
- Darwin Tropical Cyclone Warning Centre (19 January 2013). "UPDATED Tropical Cyclone 3-day Outlook for Northern Region, including the Gulf of Carpentaria". Australian Bureau of Meteorology. Archived from the original on 19 January 2013. Retrieved 24 January 2013.
- Brisbane Tropical Cyclone Warning Centre (20 January 2013). "Tropical Low 07U Tropical Cyclone Technical Bulletin". Australian Bureau of Meteorology. Archived from the original on 21 January 2013. Retrieved 24 January 2013.
- Brisbane Tropical Cyclone Warning Centre (21 January 2013). "Tropical Cyclone Oswald Tropical Cyclone Technical Bulletin". Australian Bureau of Meteorology. Archived from the original on 21 January 2013. Retrieved 24 January 2013.
- Joint Typhoon Warning Center (21 January 2013). "Tropical Cyclone 11P (Oswald) Warning NR 001". United States Navy. Archived from the original on 21 January 2013. Retrieved 24 January 2013.
- Brisbane Tropical Cyclone Warning Centre (21 January 2013). "Tropical Cyclone Oswald Tropical Cyclone Technical Bulletin". Australian Bureau of Meteorology. Archived from the original on 22 January 2013. Retrieved 24 January 2013.
- Joint Typhoon Warning Center (23 January 2013). "Significant Tropical Weather Outlook for the Western and South Pacific Oceans". United States Navy. Archived from the original on 24 January 2013. Retrieved 24 January 2013.
- Brian Williams and Peter Michael (24 January 2013). "Ex-cyclone Oswald heads south with heavy rain tipped for long weekend". The Courier Mail. Australian Associated Press. Archived from the original on 8 April 2017. Retrieved 24 January 2013.
- "In Australia, Record Weather Fuels Climate Policy Process". Leigh Dayton. American Association for the Advancement of Science. 5 February 2013. Archived from the original on 8 February 2013. Retrieved 6 February 2013.
- "Tropical Cyclone Peta". Australian Bureau of Meteorology. 2013. Retrieved 29 January 2013.
- Joint Typhoon Warning Center (21 January 2013). "Significant Tropical Weather Outlook for the Indian Ocean". United States Navy. Archived from the original on 3 December 2013. Retrieved 24 January 2013.
- Perth Tropical Cyclone Warning Centre (21 January 2013). "Tropical Low 08U Tropical Cyclone Technical Bulletin". Australian Bureau of Meteorology. Archived from the original on 21 January 2013. Retrieved 24 January 2013.
- Joint Typhoon Warning Center (21 January 2013). "Tropical Cyclone Formation Alert". United States Navy. Archived from the original on 20 September 2012. Retrieved 24 January 2013.
- Joint Typhoon Warning Center (22 January 2013). "Tropical Cyclone 12S Advisory NR 001". United States Navy. Archived from the original on 23 January 2013. Retrieved 24 January 2013.
- Perth Tropical Cyclone Warning Centre (23 January 2013). "Tropical Cyclone Peta Tropical Cyclone Technical Bulletin". Australian Bureau of Meteorology. Archived from the original on 23 January 2013. Retrieved 24 January 2013.
- Perth Tropical Cyclone Warning Centre (23 January 2013). "Ex-Tropical Cyclone Peta Tropical Cyclone Advice 16". Australian Bureau of Meteorology. Archived from the original on 24 January 2013. Retrieved 24 January 2013.
- James Regan (22 January 2013). "Storm off Australia iron belt intensifies to cyclone strength". Reuters. Sydney, Australia. Archived from the original on 21 February 2017. Retrieved 24 January 2013.
- Alex Massey and Phoebe Wearne (24 January 2013). "Peta plays havoc with weather". The West Australian. Retrieved 24 January 2013.
- "Residents seek shelter as Rusty gathers strength". Australian Broadcasting Corporation. 26 February 2013.
- "Flooding expected as Rusty rolls inland". Archived from the original on 28 February 2013. Retrieved 27 February 2013.
- "Severe Tropical Cyclone Rusty". Australian Bureau of Meteorology. Retrieved 19 March 2013.
- "Tropical Low 11U" (PDF). Australian Bureau of Meteorology. 2013. Retrieved 1 April 2013.
- Michelle Wheeler (25 February 2013). "800mm rain dumped on Cocos". The West Australian. Retrieved 1 April 2013.
- Siossian, Emma (14 March 2013). "Lord Howe Island cleans up after Cyclone Sandra". ABC News. Australian Broadcasting Corporation. Retrieved 22 March 2013.
- "Tropical Cyclone Tim – Coral Sea. Page 1". Weatherzone Forums. 12 March 2013. Retrieved 2 May 2013.
- "Tropical Cyclone Tim – Coral Sea. Page 8". Weatherzone Forums. 14 March 2013. Retrieved 2 May 2013.
- "Tropical Cyclone Tim – Coral Sea. Page 12". Weatherzone Forums. 15 March 2013. Retrieved 2 May 2013.
- "Innisfail, Queensland March 2013 Daily Weather Observations". Daily Summaries. Australian Bureau of Meteorology. 21 April 2013. Archived from the original on 21 April 2013. Retrieved 2 May 2013.
- Megan Palin (1 April 2013). "Katherine getting a drenching". Australian Broadcasting Corporation. Retrieved 1 April 2013.
- Perth Tropical Cyclone Warning Centre (6 April 2013). "Tropical Cyclone 3-day Outlook for Western Region". Australian Bureau of Meteorology. Archived from the original on 8 April 2013. Retrieved 9 April 2013.
- Severe Tropical Cyclone Victoria-Western Australian Regional Office Bureau of Meteorology. Retrieved 25 April 2013
- Brisbane Tropical Cyclone Warning Centre (29 April 2013). "Tropical Cyclone Zane Technical Bulletin". Australian Bureau of Meteorology. Archived from the original on 30 April 2013. Retrieved 30 April 2013.
- "Tropical Cyclone Zane (Coral Sea). Page 4". Weatherzone Forums. 29 May 2013. Retrieved 4 August 2013.
- "Tropical Cyclone Zane (Coral Sea). Page 8". Weatherzone Forums. 30 May 2013. Retrieved 4 August 2013.
- "Horn Island, Queensland May 2013 Daily Weather Observations". Australian Bureau of Meteorology. 31 May 2013. Archived from the original on 13 February 2014. Retrieved 4 August 2013.
- "Australian Tropical Cyclone Database" (CSV). Australian Bureau of Meteorology. 30 June 2023. Retrieved 30 June 2023. A guide on how to read the database is available here.
- "2012 Tropical Cyclone Freda (2012362S08165)". International Best Track Archive for Climate Stewardship. Retrieved 30 May 2022.
- "2013 Tropical Cyclone Tim (2013072S12140)". International Best Track Archive for Climate Stewardship. Retrieved 8 May 2022.
External links
- Joint Typhoon Warning Center (JTWC) Archived 1 March 2010 at the Wayback Machine.
- Australian Bureau of Meteorology (TCWC's Perth, Darwin & Brisbane).
- Tropical Cyclone Warning Center Jakarta.
- World Meteorological Organization