2004 United States House of Representatives elections in Arizona
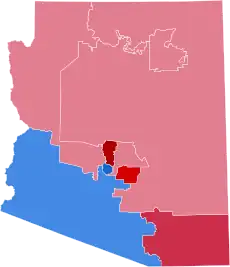
The 2004 congressional elections in Arizona were elections for Arizona's delegation to the United States House of Representatives, which occurred along with congressional elections nationwide on November 2, 2004. Arizona has eight seats, as apportioned during the 2000 United States Census. Republicans held six of the eight seats and Democrats held two. This would be the last time until 2022 that Republicans would win 6 House seats in Arizona.
| |||||||||||||||||||||||||||||||||
All 8 Arizona seats to the United States House of Representatives | |||||||||||||||||||||||||||||||||
|---|---|---|---|---|---|---|---|---|---|---|---|---|---|---|---|---|---|---|---|---|---|---|---|---|---|---|---|---|---|---|---|---|---|
| |||||||||||||||||||||||||||||||||
| |||||||||||||||||||||||||||||||||
| Elections in Arizona |
|---|
 |
Overview
| 2004 United States House of Representatives elections in Arizona[1][2] | |||||
|---|---|---|---|---|---|
| Party | Votes | Percentage | Seats | +/– | |
| Republican | 1,127,591 | 60.25% | 6 | - | |
| Democratic | 597,526 | 31.93% | 2 | - | |
| Libertarian | 146,316 | 7.82% | 0 | - | |
| Independents | 12 | <0.01% | 0 | - | |
| Totals | 1,871,445 | 100.00% | 8 | - | |
Results
District 1
| |||||||||||||||||||||
 County results Renzi: 50-60% 60–70% 70–80% Babbitt: 40–50% | |||||||||||||||||||||
| |||||||||||||||||||||


| Party | Candidate | Votes | % | ||
|---|---|---|---|---|---|
| Republican | Rick Renzi (incumbent) | 148,315 | 58.54% | ||
| Democratic | Paul Babbitt | 91,776 | 36.22% | ||
| Libertarian | John Crockett | 13,260 | 5.23% | ||
| Total votes | 253,251 | 100.00% | |||
| Republican hold | |||||
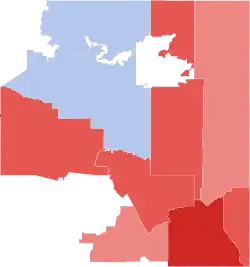
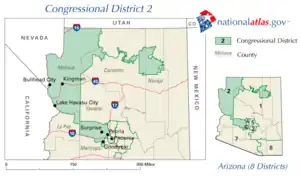
District 2
| |||||||||||||||||
 County results Franks: 50–60% 60-70% Camacho: 70-80% Tie | |||||||||||||||||
| |||||||||||||||||

| Party | Candidate | Votes | % | ||
|---|---|---|---|---|---|
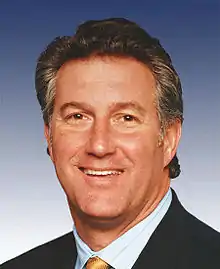
| Republican | Trent Franks (incumbent) | 165,260 | 59.17% | ||
| Democratic | Randy Camacho | 107,406 | 38.46% | ||
| Libertarian | Powell Gammill | 6,625 | 2.37% | ||
| Write-in | 12 | 0.00% | |||
| Total votes | 279,303 | 100.00% | |||
| Republican hold | |||||
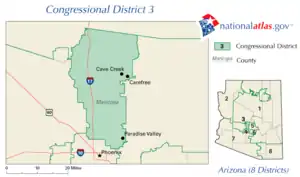
District 3
| |||||||||||||||||
 County results Shadegg: 80–90% | |||||||||||||||||
| |||||||||||||||||
| Party | Candidate | Votes | % | ||
|---|---|---|---|---|---|
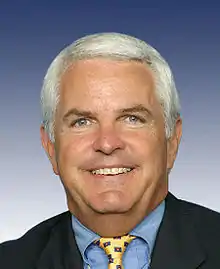
| Republican | John Shadegg (incumbent) | 181,012 | 80.10% | ||
| Libertarian | Mark Yannone | 44,962 | 19.90% | ||
| Total votes | 225,974 | 100.00% | |||
| Republican hold | |||||
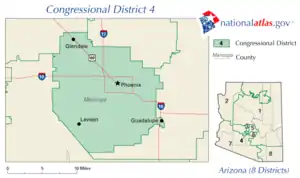
District 4
| |||||||||||||||||
 County results Pastor: 70-80% | |||||||||||||||||
| |||||||||||||||||

| Party | Candidate | Votes | % | ||
|---|---|---|---|---|---|
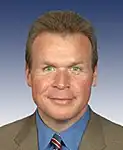
| Democratic | Ed Pastor (incumbent) | 77,150 | 70.12% | ||
| Republican | Don Karg | 28,238 | 25.66% | ||
| Libertarian | Gary Fallon | 4,639 | 4.22% | ||
| Total votes | 110,027 | 100.00% | |||
| Democratic hold | |||||
District 5
| |||||||||||||||||
 County results Hayworth: 50–60% | |||||||||||||||||
| |||||||||||||||||

| Party | Candidate | Votes | % | ||
|---|---|---|---|---|---|
| Republican | J. D. Hayworth (incumbent) | 159,455 | 59.50% | ||
| Democratic | Elizabeth Rogers | 102,363 | 38.19% | ||
| Libertarian | Michael Kielsky | 6,189 | 2.31% | ||
| Total votes | 268,007 | 100.00% | |||
| Republican hold | |||||
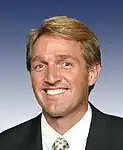
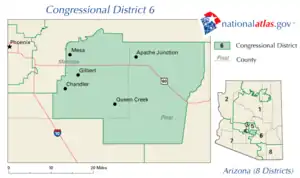
District 6
| |||||||||||||||||
 County results Flake: 70–80% | |||||||||||||||||
| |||||||||||||||||
| Party | Candidate | Votes | % | ||
|---|---|---|---|---|---|
| Republican | Jeff Flake (incumbent) | 202,882 | 79.38% | ||
| Libertarian | Craig Stritar | 52,695 | 20.62% | ||
| Total votes | 255,577 | 100.00% | |||
| Republican hold | |||||
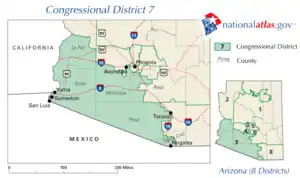
District 7
| |||||||||||||||||
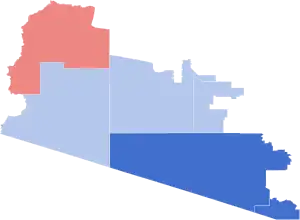 County results Grijalva: 40-50% 70-80% Drake: 50–60% | |||||||||||||||||
| |||||||||||||||||
.jpg.webp)
| Party | Candidate | Votes | % | ||
|---|---|---|---|---|---|
| Democratic | Raúl Grijalva (incumbent) | 108,868 | 62.06% | ||
| Republican | Joseph Sweeney | 59,066 | 33.67% | ||
| Libertarian | Dave Kaplan | 7,503 | 4.28% | ||
| Total votes | 175,437 | 100.00% | |||
| Democratic hold | |||||
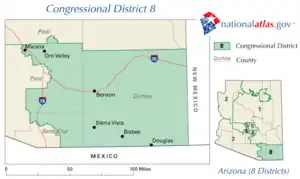
District 8
| |||||||||||||||||
 County results Kolbe: 50-60% 60-70% | |||||||||||||||||
| |||||||||||||||||


| Party | Candidate | Votes | % | ||
|---|---|---|---|---|---|
| Republican | Jim Kolbe (incumbent) | 183,363 | 60.36% | ||
| Democratic | Eva Bacal | 109,963 | 36.20% | ||
| Libertarian | Robert Anderson | 10,443 | 3.44% | ||
| Total votes | 303,769 | 100.00% | |||
| Republican hold | |||||
This article is issued from Wikipedia. The text is licensed under Creative Commons - Attribution - Sharealike. Additional terms may apply for the media files.