Valby (nomination district)
Valby nominating district is one of the 92 nominating districts that was created for Danish elections following the 2007 municipal reform.[3][4][5] It is one of the 9 nominating districts in Copenhagen Municipality.[6] It was created in 1895.[7] In 1915 its boundaries were changed, and it became a nomination district. In 1953 it was divided into Valby-vest and Valby-øst.[8] Valby-vest was renamed Valby from 1970 onwards,[9] and this nomination district was expanded in area in 2007.
| Valby | |
|---|---|
| Valby | |
| Nomination district constituency for the Folketing | |
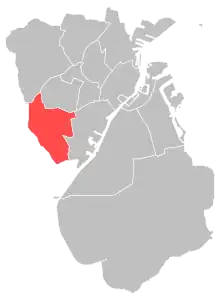 Location of Valby within Copenhagen | |
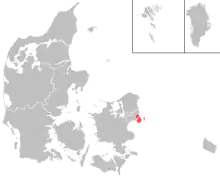 Location of Copenhagen within Denmark | |
| Municipalities | Copenhagen |
| Constituency | Copenhagen |
| Electorate | 42,583 (2022)[1] |
| Current constituency | |
| Created | 1895 (as constituency)[2] 1915 (as nomination district) |
In general elections, the district is a very strong area for parties commonly associated with the red bloc.[10]
General elections results
General elections in the 2020s
| Parties | Vote | |||||
|---|---|---|---|---|---|---|
| Votes | % | + / - | ||||
| Social Democrats | 7,107 | 20.84 | +0.84 | |||
| Green Left | 4,244 | 12.45 | +0.21 | |||
| Red–Green Alliance | 4,121 | 12.09 | -3.46 | |||
| Moderates | 3,093 | 9.07 | New | |||
| Venstre | 2,984 | 8.75 | -5.66 | |||
| Liberal Alliance | 2,931 | 8.60 | +6.00 | |||
| The Alternative | 2,677 | 7.85 | +2.03 | |||
| Social Liberals | 2,409 | 7.06 | -8.14 | |||
| Conservatives | 1,575 | 4.62 | +0.48 | |||
| Independent Greens | 897 | 2.63 | New | |||
| Denmark Democrats | 706 | 2.07 | New | |||
| New Right | 643 | 1.89 | +0.31 | |||
| Danish People's Party | 581 | 1.70 | -3.15 | |||
| Christian Democrats | 65 | 0.19 | -0.67 | |||
| Flemming Blicher | 55 | 0.16 | New | |||
| Tom Gillesberg | 10 | 0.03 | 0.00 | |||
| Total | 34,098 | |||||
| Source[11] | ||||||
General elections in the 2010s
| Parties | Vote | |||||
|---|---|---|---|---|---|---|
| Votes | % | + / - | ||||
| Social Democrats | 6,491 | 20.00 | -5.31 | |||
| Red–Green Alliance | 5,048 | 15.55 | -0.27 | |||
| Social Liberals | 4,932 | 15.20 | +7.21 | |||
| Venstre | 4,676 | 14.41 | +4.58 | |||
| Green Left | 3,971 | 12.24 | +5.32 | |||
| The Alternative | 1,889 | 5.82 | -3.08 | |||
| Danish People's Party | 1,573 | 4.85 | -9.08 | |||
| Conservatives | 1,342 | 4.14 | +1.52 | |||
| Liberal Alliance | 843 | 2.60 | -5.31 | |||
| Stram Kurs | 519 | 1.60 | New | |||
| New Right | 512 | 1.58 | New | |||
| Klaus Riskær Pedersen Party | 329 | 1.01 | New | |||
| Christian Democrats | 280 | 0.86 | +0.39 | |||
| Pierre Tavares | 29 | 0.09 | New | |||
| Tom Gillesberg | 9 | 0.03 | 0.00 | |||
| John Jørgensen | 6 | 0.02 | New | |||
| Tommy Schou Christesen | 3 | 0.01 | New | |||
| John Erik Wagner | 1 | 0.00 | -0.01 | |||
| Total | 32,453 | |||||
| Source[12] | ||||||
| Parties | Vote | |||||
|---|---|---|---|---|---|---|
| Votes | % | + / - | ||||
| Social Democrats | 7,432 | 25.31 | +2.19 | |||
| Red–Green Alliance | 4,646 | 15.82 | +1.09 | |||
| Danish People's Party | 4,091 | 13.93 | +3.62 | |||
| Venstre | 2,886 | 9.83 | -5.26 | |||
| The Alternative | 2,612 | 8.90 | New | |||
| Social Liberals | 2,346 | 7.99 | -5.97 | |||
| Liberal Alliance | 2,323 | 7.91 | +2.97 | |||
| Green Left | 2,031 | 6.92 | -6.11 | |||
| Conservatives | 769 | 2.62 | -1.83 | |||
| Christian Democrats | 139 | 0.47 | +0.17 | |||
| Kashif Ahmad | 74 | 0.25 | New | |||
| Tom Gillesberg | 10 | 0.03 | 0.00 | |||
| John Erik Wagner | 3 | 0.01 | +0.01 | |||
| Jan Elkjær | 2 | 0.01 | New | |||
| Total | 29,364 | |||||
| Source[13] | ||||||
| Parties | Vote | |||||
|---|---|---|---|---|---|---|
| Votes | % | + / - | ||||
| Social Democrats | 6,645 | 23.12 | -4.11 | |||
| Venstre | 4,338 | 15.09 | +2.02 | |||
| Red–Green Alliance | 4,235 | 14.73 | +9.19 | |||
| Social Liberals | 4,012 | 13.96 | +6.84 | |||
| Green Left | 3,744 | 13.03 | -8.33 | |||
| Danish People's Party | 2,964 | 10.31 | -2.81 | |||
| Liberal Alliance | 1,419 | 4.94 | +1.32 | |||
| Conservatives | 1,278 | 4.45 | -4.01 | |||
| Christian Democrats | 85 | 0.30 | -0.14 | |||
| Tom Gillesberg | 9 | 0.03 | +0.03 | |||
| Klaus Trier Tuxen | 8 | 0.03 | New | |||
| Mads Vestergaard | 5 | 0.02 | New | |||
| Per Zimmermann | 1 | 0.00 | New | |||
| Morten Versner | 0 | 0.00 | New | |||
| John Erik Wagner | 0 | 0.00 | -0.01 | |||
| Total | 28,743 | |||||
| Source[14] | ||||||
General elections in the 2000s
| Parties | Vote | |||||
|---|---|---|---|---|---|---|
| Votes | % | + / - | ||||
| Social Democrats | 7,437 | 27.23 | -0.93 | |||
| Green Left | 5,832 | 21.36 | +11.30 | |||
| Danish People's Party | 3,582 | 13.12 | -1.37 | |||
| Venstre | 3,568 | 13.07 | -2.62 | |||
| Conservatives | 2,311 | 8.46 | +0.52 | |||
| Social Liberals | 1,945 | 7.12 | -6.96 | |||
| Red–Green Alliance | 1,514 | 5.54 | -1.67 | |||
| New Alliance | 988 | 3.62 | New | |||
| Christian Democrats | 119 | 0.44 | -0.45 | |||
| Nicolai Krogh Mittet | 4 | 0.01 | New | |||
| Vibeke Baden Laursen | 3 | 0.01 | New | |||
| John Erik Wagner | 3 | 0.01 | New | |||
| Amir Becirovic | 1 | 0.00 | New | |||
| Tom Gillesberg | 0 | 0.00 | New | |||
| Total | 27,307 | |||||
| Source[15] | ||||||
| Parties | Vote | |||||
|---|---|---|---|---|---|---|
| Votes | % | + / - | ||||
| Social Democrats | 5,747 | 28.16 | -4.88 | |||
| Venstre | 3,201 | 15.69 | -2.97 | |||
| Danish People's Party | 2,957 | 14.49 | +0.46 | |||
| Social Liberals | 2,874 | 14.08 | +7.61 | |||
| Green Left | 2,054 | 10.06 | -1.54 | |||
| Conservatives | 1,620 | 7.94 | +1.02 | |||
| Red–Green Alliance | 1,472 | 7.21 | +1.90 | |||
| Centre Democrats | 222 | 1.09 | -0.86 | |||
| Christian Democrats | 182 | 0.89 | -0.73 | |||
| Minority Party | 79 | 0.39 | New | |||
| Total | 20,408 | |||||
| Source[16] | ||||||
| Parties | Vote | |||||
|---|---|---|---|---|---|---|
| Votes | % | + / - | ||||
| Social Democrats | 7,034 | 33.04 | -9.66 | |||
| Venstre | 3,972 | 18.66 | +5.50 | |||
| Danish People's Party | 2,986 | 14.03 | +4.43 | |||
| Green Left | 2,470 | 11.60 | +0.32 | |||
| Conservatives | 1,474 | 6.92 | +0.19 | |||
| Social Liberals | 1,378 | 6.47 | +2.49 | |||
| Red–Green Alliance | 1,130 | 5.31 | -0.67 | |||
| Centre Democrats | 415 | 1.95 | -1.60 | |||
| Christian People's Party | 345 | 1.62 | +0.39 | |||
| Progress Party | 86 | 0.40 | -1.06 | |||
| Total | 21,290 | |||||
| Source[17] | ||||||
General elections in the 1990s
| Parties | Vote | |||||
|---|---|---|---|---|---|---|
| Votes | % | + / - | ||||
| Social Democrats | 9,119 | 42.70 | +0.88 | |||
| Venstre | 2,811 | 13.16 | +1.79 | |||
| Green Left | 2,409 | 11.28 | -0.93 | |||
| Danish People's Party | 2,050 | 9.60 | New | |||
| Conservatives | 1,437 | 6.73 | -5.90 | |||
| Red–Green Alliance | 1,278 | 5.98 | -1.45 | |||
| Social Liberals | 849 | 3.98 | -0.24 | |||
| Centre Democrats | 758 | 3.55 | +1.10 | |||
| Progress Party | 312 | 1.46 | -5.13 | |||
| Christian People's Party | 263 | 1.23 | +0.13 | |||
| Democratic Renewal | 71 | 0.33 | New | |||
| Total | 21,357 | |||||
| Source[18] | ||||||
| Parties | Vote | |||||
|---|---|---|---|---|---|---|
| Votes | % | + / - | ||||
| Social Democrats | 8,629 | 41.82 | -7.61 | |||
| Conservatives | 2,606 | 12.63 | +1.25 | |||
| Green Left | 2,520 | 12.21 | -0.94 | |||
| Venstre | 2,347 | 11.37 | +5.64 | |||
| Red–Green Alliance | 1,533 | 7.43 | +3.87 | |||
| Progress Party | 1,359 | 6.59 | +2.81 | |||
| Social Liberals | 871 | 4.22 | +1.64 | |||
| Centre Democrats | 506 | 2.45 | -1.31 | |||
| Christian People's Party | 226 | 1.10 | -0.08 | |||
| Ebba Bigler | 36 | 0.17 | New | |||
| Total | 20,633 | |||||
| Source[19] | ||||||
| Parties | Vote | |||||
|---|---|---|---|---|---|---|
| Votes | % | + / - | ||||
| Social Democrats | 10,465 | 49.43 | +10.95 | |||
| Green Left | 2,783 | 13.15 | -8.36 | |||
| Conservatives | 2,409 | 11.38 | -3.31 | |||
| Venstre | 1,213 | 5.73 | +2.87 | |||
| Common Course | 808 | 3.82 | +0.49 | |||
| Progress Party | 800 | 3.78 | -2.41 | |||
| Centre Democrats | 795 | 3.76 | +0.91 | |||
| Red–Green Alliance | 754 | 3.56 | New | |||
| Social Liberals | 547 | 2.58 | -1.90 | |||
| Christian People's Party | 249 | 1.18 | +0.01 | |||
| The Greens | 195 | 0.92 | -0.57 | |||
| Justice Party of Denmark | 136 | 0.64 | New | |||
| Humanist Party | 17 | 0.08 | New | |||
| Total | 21,171 | |||||
| Source[20] | ||||||
General elections in the 1980s
| Parties | Vote | |||||
|---|---|---|---|---|---|---|
| Votes | % | + / - | ||||
| Social Democrats | 8,680 | 38.48 | +1.75 | |||
| Green Left | 4,851 | 21.51 | -3.41 | |||
| Conservatives | 3,313 | 14.69 | -0.08 | |||
| Progress Party | 1,397 | 6.19 | +2.89 | |||
| Social Liberals | 1,011 | 4.48 | -0.18 | |||
| Common Course | 750 | 3.33 | -0.05 | |||
| Venstre | 646 | 2.86 | +1.82 | |||
| Centre Democrats | 643 | 2.85 | -0.21 | |||
| Communist Party of Denmark | 394 | 1.75 | -0.05 | |||
| The Greens | 337 | 1.49 | +0.14 | |||
| Left Socialists | 270 | 1.20 | -1.53 | |||
| Christian People's Party | 264 | 1.17 | -0.13 | |||
| Total | 22,556 | |||||
| Source[21] | ||||||
| Parties | Vote | |||||
|---|---|---|---|---|---|---|
| Votes | % | + / - | ||||
| Social Democrats | 8,335 | 36.73 | -7.49 | |||
| Green Left | 5,656 | 24.92 | +6.81 | |||
| Conservatives | 3,351 | 14.77 | -2.29 | |||
| Social Liberals | 1,058 | 4.66 | +0.82 | |||
| Common Course | 767 | 3.38 | New | |||
| Progress Party | 749 | 3.30 | +0.95 | |||
| Centre Democrats | 694 | 3.06 | +0.40 | |||
| Left Socialists | 619 | 2.73 | -1.80 | |||
| Communist Party of Denmark | 408 | 1.80 | +0.31 | |||
| The Greens | 306 | 1.35 | New | |||
| Christian People's Party | 296 | 1.30 | -0.08 | |||
| Venstre | 235 | 1.04 | -1.27 | |||
| Justice Party of Denmark | 137 | 0.60 | -1.36 | |||
| Humanist Party | 49 | 0.22 | New | |||
| Socialist Workers Party | 20 | 0.09 | +0.02 | |||
| Marxist–Leninists Party | 15 | 0.07 | +0.03 | |||
| Total | 22,695 | |||||
| Source[22] | ||||||
| Parties | Vote | |||||
|---|---|---|---|---|---|---|
| Votes | % | + / - | ||||
| Social Democrats | 10,893 | 44.22 | +0.08 | |||
| Green Left | 4,461 | 18.11 | -1.06 | |||
| Conservatives | 4,203 | 17.06 | +6.40 | |||
| Left Socialists | 1,115 | 4.53 | +0.33 | |||
| Social Liberals | 945 | 3.84 | -0.19 | |||
| Centre Democrats | 655 | 2.66 | -2.36 | |||
| Progress Party | 578 | 2.35 | -3.35 | |||
| Venstre | 570 | 2.31 | +0.66 | |||
| Justice Party of Denmark | 483 | 1.96 | +0.27 | |||
| Communist Party of Denmark | 366 | 1.49 | -0.82 | |||
| Christian People's Party | 340 | 1.38 | +0.27 | |||
| Socialist Workers Party | 17 | 0.07 | -0.04 | |||
| Marxist–Leninists Party | 10 | 0.04 | New | |||
| Total | 24,636 | |||||
| Source[23] | ||||||
| Parties | Vote | |||||
|---|---|---|---|---|---|---|
| Votes | % | + / - | ||||
| Social Democrats | 10,257 | 44.14 | -8.64 | |||
| Green Left | 4,454 | 19.17 | +10.03 | |||
| Conservatives | 2,477 | 10.66 | +1.99 | |||
| Progress Party | 1,325 | 5.70 | -0.71 | |||
| Centre Democrats | 1,166 | 5.02 | +3.30 | |||
| Left Socialists | 977 | 4.20 | -1.69 | |||
| Social Liberals | 937 | 4.03 | -0.43 | |||
| Communist Party of Denmark | 536 | 2.31 | -1.09 | |||
| Justice Party of Denmark | 392 | 1.69 | -1.41 | |||
| Venstre | 383 | 1.65 | -0.82 | |||
| Christian People's Party | 258 | 1.11 | -0.25 | |||
| Communist Workers Party | 48 | 0.21 | -0.36 | |||
| Socialist Workers Party | 25 | 0.11 | New | |||
| Total | 23,235 | |||||
| Source[24] | ||||||
General elections in the 1970s
| Parties | Vote | |||||
|---|---|---|---|---|---|---|
| Votes | % | + / - | ||||
| Social Democrats | 12,672 | 52.78 | -0.02 | |||
| Green Left | 2,194 | 9.14 | +3.05 | |||
| Conservatives | 2,081 | 8.67 | +2.37 | |||
| Progress Party | 1,540 | 6.41 | -2.46 | |||
| Left Socialists | 1,413 | 5.89 | +2.35 | |||
| Social Liberals | 1,071 | 4.46 | +2.36 | |||
| Communist Party of Denmark | 816 | 3.40 | -3.65 | |||
| Justice Party of Denmark | 745 | 3.10 | -1.06 | |||
| Venstre | 592 | 2.47 | +0.31 | |||
| Centre Democrats | 413 | 1.72 | -2.44 | |||
| Christian People's Party | 327 | 1.36 | -0.04 | |||
| Communist Workers Party | 138 | 0.57 | New | |||
| Thorkild Weiss Madsen | 6 | 0.02 | New | |||
| Total | 24,008 | |||||
| Source[25] | ||||||
| Parties | Vote | |||||
|---|---|---|---|---|---|---|
| Votes | % | + / - | ||||
| Social Democrats | 13,273 | 52.80 | +9.32 | |||
| Progress Party | 2,230 | 8.87 | -0.87 | |||
| Communist Party of Denmark | 1,772 | 7.05 | -1.50 | |||
| Conservatives | 1,584 | 6.30 | +1.65 | |||
| Green Left | 1,532 | 6.09 | -3.21 | |||
| Justice Party of Denmark | 1,046 | 4.16 | +2.53 | |||
| Justice Party of Denmark | 1,046 | 4.16 | +2.53 | |||
| Left Socialists | 891 | 3.54 | +0.91 | |||
| Venstre | 542 | 2.16 | -7.48 | |||
| Social Liberals | 527 | 2.10 | -3.73 | |||
| Christian People's Party | 351 | 1.40 | -1.79 | |||
| Pensioners' Party | 337 | 1.34 | New | |||
| Niels Kjær-Larsen | 8 | 0.03 | New | |||
| Total | 25,139 | |||||
| Source[26] | ||||||
| Parties | Vote | |||||
|---|---|---|---|---|---|---|
| Votes | % | + / - | ||||
| Social Democrats | 11,229 | 43.48 | +5.57 | |||
| Progress Party | 2,515 | 9.74 | -0.77 | |||
| Venstre | 2,491 | 9.64 | +7.28 | |||
| Green Left | 2,401 | 9.30 | -2.63 | |||
| Communist Party of Denmark | 2,207 | 8.55 | +1.11 | |||
| Social Liberals | 1,505 | 5.83 | -1.98 | |||
| Conservatives | 1,202 | 4.65 | -3.28 | |||
| Christian People's Party | 824 | 3.19 | +1.16 | |||
| Left Socialists | 678 | 2.63 | +0.73 | |||
| Justice Party of Denmark | 422 | 1.63 | -1.10 | |||
| Centre Democrats | 347 | 1.34 | -6.10 | |||
| Otto Holtermann | 6 | 0.02 | New | |||
| Total | 25,827 | |||||
| Source[27] | ||||||
| Parties | Vote | |||||
|---|---|---|---|---|---|---|
| Votes | % | + / - | ||||
| Social Democrats | 10,112 | 37.91 | -8.65 | |||
| Green Left | 3,183 | 11.93 | -6.39 | |||
| Progress Party | 2,804 | 10.51 | New | |||
| Conservatives | 2,115 | 7.93 | -6.19 | |||
| Social Liberals | 2,083 | 7.81 | -3.09 | |||
| Centre Democrats | 1,985 | 7.44 | New | |||
| Communist Party of Denmark | 1,984 | 7.44 | +4.69 | |||
| Justice Party of Denmark | 728 | 2.73 | +1.01 | |||
| Venstre | 629 | 2.36 | -0.12 | |||
| Christian People's Party | 541 | 2.03 | +1.06 | |||
| Left Socialists | 507 | 1.90 | -0.29 | |||
| Bent Jespersen | 3 | 0.01 | New | |||
| Anne Vedelstierne | 1 | 0.00 | New | |||
| Total | 26,675 | |||||
| Source[28] | ||||||
| Parties | Vote | |||||
|---|---|---|---|---|---|---|
| Votes | % | + / - | ||||
| Social Democrats | 12,673 | 46.56 | ||||
| Green Left | 4,987 | 18.32 | ||||
| Conservatives | 3,843 | 14.12 | ||||
| Social Liberals | 2,966 | 10.90 | ||||
| Communist Party of Denmark | 748 | 2.75 | ||||
| Venstre | 675 | 2.48 | ||||
| Left Socialists | 595 | 2.19 | ||||
| Justice Party of Denmark | 467 | 1.72 | ||||
| Christian People's Party | 263 | 0.97 | ||||
| Total | 27,217 | |||||
| Source[29] | ||||||
General elections in the 1950s
April 1953 Danish Folketing election
| Parties | Vote | |||||
|---|---|---|---|---|---|---|
| Votes | % | + / - | ||||
| Social Democrats | 27,244 | 56.83 | +1.44 | |||
| Conservatives | 7,696 | 16.05 | -0.27 | |||
| Communist Party of Denmark | 5,191 | 10.83 | -0.37 | |||
| Social Liberals | 3,412 | 7.12 | +0.65 | |||
| Justice Party of Denmark | 2,414 | 5.04 | -3.74 | |||
| Venstre | 1,610 | 3.36 | +1.52 | |||
| Danish Unity | 373 | 0.78 | New | |||
| Total | 47,940 | |||||
| Source[30] | ||||||
1950 Danish Folketing election
| Parties | Vote | |||||
|---|---|---|---|---|---|---|
| Votes | % | + / - | ||||
| Social Democrats | 26,044 | 55.39 | +0.43 | |||
| Conservatives | 7,676 | 16.32 | +4.51 | |||
| Communist Party of Denmark | 5,265 | 11.20 | -4.50 | |||
| Justice Party of Denmark | 4,129 | 8.78 | +4.44 | |||
| Social Liberals | 3,041 | 6.47 | +1.35 | |||
| Venstre | 867 | 1.84 | -5.04 | |||
| Total | 47,022 | |||||
| Source[31] | ||||||
General elections in the 1940s
1947 Danish Folketing election
| Parties | Vote | |||||
|---|---|---|---|---|---|---|
| Votes | % | + / - | ||||
| Social Democrats | 26,334 | 54.96 | +14.06 | |||
| Communist Party of Denmark | 7,524 | 15.70 | -11.49 | |||
| Conservatives | 5,660 | 11.81 | -7.59 | |||
| Capital Venstre | 3,295 | 6.88 | +4.03 | |||
| Social Liberals | 2,454 | 5.12 | -0.29 | |||
| Justice Party of Denmark | 2,081 | 4.34 | +3.31 | |||
| Danish Unity | 567 | 1.18 | -2.06 | |||
| Total | 47,915 | |||||
| Source[32] | ||||||
1945 Danish Folketing election
| Parties | Vote | |||||
|---|---|---|---|---|---|---|
| Votes | % | + / - | ||||
| Social Democrats | 19,346 | 40.90 | -22.58 | |||
| Communist Party of Denmark | 12,861 | 27.19 | New | |||
| Conservatives | 9,175 | 19.40 | -1.23 | |||
| Social Liberals | 2,558 | 5.41 | -2.41 | |||
| Danish Unity | 1,531 | 3.24 | -0.22 | |||
| Venstre | 1,347 | 2.85 | +2.16 | |||
| Justice Party of Denmark | 486 | 1.03 | -0.17 | |||
| Total | 47,304 | |||||
| Source[33] | ||||||
1943 Danish Folketing election
| Parties | Vote | |||||
|---|---|---|---|---|---|---|
| Votes | % | + / - | ||||
| Social Democrats | 28,408 | 63.48 | -2.07 | |||
| Conservatives | 9,232 | 20.63 | +4.62 | |||
| Social Liberals | 3,501 | 7.82 | -1.08 | |||
| Danish Unity | 1,550 | 3.46 | +2.99 | |||
| National Socialist Workers' Party of Denmark | 1,209 | 2.70 | +1.07 | |||
| Justice Party of Denmark | 539 | 1.20 | +0.18 | |||
| Venstre | 309 | 0.69 | -0.14 | |||
| Total | 44,748 | |||||
| Source[34] | ||||||
General elections in the 1930s
1939 Danish Folketing election
| Parties | Vote | |||||
|---|---|---|---|---|---|---|
| Votes | % | + / - | ||||
| Social Democrats | 23,734 | 65.55 | -3.46 | |||
| Conservatives | 5,797 | 16.01 | -1.65 | |||
| Social Liberals | 3,224 | 8.90 | +1.49 | |||
| Communist Party of Denmark | 1,688 | 4.66 | +1.30 | |||
| National Socialist Workers' Party of Denmark | 590 | 1.63 | +1.05 | |||
| Justice Party of Denmark | 371 | 1.02 | -0.60 | |||
| National Cooperation | 333 | 0.92 | New | |||
| Venstre | 300 | 0.83 | +0.48 | |||
| Danish Unity | 170 | 0.47 | New | |||
| Total | 36,207 | |||||
| Source[35] | ||||||
1935 Danish Folketing election
| Parties | Vote | |||||
|---|---|---|---|---|---|---|
| Votes | % | + / - | ||||
| Social Democrats | 24,379 | 69.01 | -0.42 | |||
| Conservatives | 6,239 | 17.66 | -0.11 | |||
| Social Liberals | 2,618 | 7.41 | +0.59 | |||
| Communist Party of Denmark | 1,186 | 3.36 | +0.65 | |||
| Justice Party of Denmark | 574 | 1.62 | -0.37 | |||
| National Socialist Workers' Party of Denmark | 206 | 0.58 | New | |||
| Venstre | 125 | 0.35 | -0.91 | |||
| Total | 35,327 | |||||
| Source[36] | ||||||
1932 Danish Folketing election
| Parties | Vote | |||||
|---|---|---|---|---|---|---|
| Votes | % | + / - | ||||
| Social Democrats | 20,056 | 69.43 | -2.32 | |||
| Conservatives | 5,133 | 17.77 | +1.21 | |||
| Social Liberals | 1,971 | 6.82 | 0.00 | |||
| Communist Party of Denmark | 784 | 2.71 | +2.20 | |||
| Justice Party of Denmark | 576 | 1.99 | +0.05 | |||
| Venstre | 364 | 1.26 | -1.15 | |||
| Curt C. Hansen | 4 | 0.01 | New | |||
| Total | 28,888 | |||||
| Source[37] | ||||||
General elections in the 1920s
1929 Danish Folketing election
| Parties | Vote | |||||
|---|---|---|---|---|---|---|
| Votes | % | + / - | ||||
| Social Democrats | 16,722 | 71.75 | +7.44 | |||
| Conservatives | 3,860 | 16.56 | -6.03 | |||
| Social Liberals | 1,590 | 6.82 | -2.02 | |||
| Venstre | 562 | 2.41 | +0.66 | |||
| Justice Party of Denmark | 453 | 1.94 | +0.60 | |||
| Communist Party of Denmark | 119 | 0.51 | -0.65 | |||
| Total | 23,306 | |||||
| Source[38] | ||||||
1926 Danish Folketing election
| Parties | Vote | |||||
|---|---|---|---|---|---|---|
| Votes | % | + / - | ||||
| Social Democrats | 13,532 | 64.31 | -1.14 | |||
| Conservatives | 4,754 | 22.59 | +2.75 | |||
| Social Liberals | 1,861 | 8.84 | -0.58 | |||
| Venstre | 368 | 1.75 | -0.66 | |||
| Justice Party of Denmark | 282 | 1.34 | +0.13 | |||
| Communist Party of Denmark | 244 | 1.16 | +0.13 | |||
| Total | 21,041 | |||||
| Source[39] | ||||||
1924 Danish Folketing election
| Parties | Vote | |||||
|---|---|---|---|---|---|---|
| Votes | % | + / - | ||||
| Social Democrats | 13,075 | 65.45 | +2.24 | |||
| Conservatives | 3,963 | 19.84 | +1.33 | |||
| Social Liberals | 1,881 | 9.42 | +2.60 | |||
| Venstre | 482 | 2.41 | -1.58 | |||
| Justice Party of Denmark | 242 | 1.21 | New | |||
| Communist Party of Denmark | 206 | 1.03 | New | |||
| Industry Party | 129 | 0.65 | -3.77 | |||
| Total | 19,978 | |||||
| Source[40] | ||||||
September 1920 Danish Folketing election
| Parties | Vote | |||||
|---|---|---|---|---|---|---|
| Votes | % | + / - | ||||
| Social Democrats | 10,577 | 63.21 | +1.31 | |||
| Conservatives | 3,097 | 18.51 | -1.54 | |||
| Social Liberals | 1,142 | 6.82 | +0.33 | |||
| Industry Party | 740 | 4.42 | -1.31 | |||
| Venstre | 667 | 3.99 | -1.22 | |||
| Free Social Democrats | 383 | 2.29 | New | |||
| Danish Left Socialist Party | 127 | 0.76 | New | |||
| Total | 16,733 | |||||
| Source[41] | ||||||
July 1920 Danish Folketing election
| Parties | Vote | |||||
|---|---|---|---|---|---|---|
| Votes | % | + / - | ||||
| Social Democrats | 7,929 | 61.90 | +5.07 | |||
| Conservatives | 2,568 | 20.05 | -0.34 | |||
| Social Liberals | 831 | 6.49 | -0.41 | |||
| Industry Party | 734 | 5.73 | -0.76 | |||
| Venstre | 668 | 5.21 | -0.15 | |||
| J. L. Knudsen | 46 | 0.36 | New | |||
| Henrik Jarlbæk | 29 | 0.23 | -0.52 | |||
| Jensine M. Nielsen-Barbro | 5 | 0.04 | New | |||
| Th. S. Damsgaard Schmidt | 0 | 0.00 | New | |||
| Total | 12,810 | |||||
| Source[42] | ||||||
April 1920 Danish Folketing election
| Parties | Vote | |||||
|---|---|---|---|---|---|---|
| Votes | % | |||||
| Social Democrats | 8,270 | 56.83 | ||||
| Conservatives | 2,967 | 20.39 | ||||
| Social Liberals | 1,004 | 6.90 | ||||
| Industry Party | 944 | 6.49 | ||||
| Venstre | 780 | 5.36 | ||||
| Free Social Democrats | 266 | 1.83 | ||||
| Centrum | 211 | 1.45 | ||||
| Henrik Jarlbæk | 109 | 0.75 | ||||
| Total | 14,551 | |||||
| Source[43] | ||||||
European Parliament elections results
2019 European Parliament election in Denmark
| Parties | Vote | |||||
|---|---|---|---|---|---|---|
| Votes | % | + / - | ||||
| Green Left | 5,709 | 22.11 | +2.59 | |||
| Social Democrats | 4,501 | 17.43 | -2.30 | |||
| Social Liberals | 4,012 | 15.54 | +5.38 | |||
| Venstre | 2,817 | 10.91 | +2.36 | |||
| Red–Green Alliance | 2,720 | 10.53 | New | |||
| The Alternative | 1,640 | 6.35 | New | |||
| Danish People's Party | 1,594 | 6.17 | -13.43 | |||
| Conservatives | 1,283 | 4.97 | -1.14 | |||
| People's Movement against the EU | 1,066 | 4.13 | -9.02 | |||
| Liberal Alliance | 480 | 1.86 | -1.32 | |||
| Total | 25,822 | |||||
| Source[44] | ||||||
2014 European Parliament election in Denmark
| Parties | Vote | |||||
|---|---|---|---|---|---|---|
| Votes | % | + / - | ||||
| Social Democrats | 3,739 | 19.73 | -1.57 | |||
| Danish People's Party | 3,715 | 19.60 | +6.82 | |||
| Green Left | 3,699 | 19.52 | -5.15 | |||
| People's Movement against the EU | 2,493 | 13.15 | +0.11 | |||
| Social Liberals | 1,925 | 10.16 | +3.38 | |||
| Venstre | 1,621 | 8.55 | -1.24 | |||
| Conservatives | 1,158 | 6.11 | -1.85 | |||
| Liberal Alliance | 602 | 3.18 | +2.45 | |||
| Total | 18,952 | |||||
| Source[45] | ||||||
2009 European Parliament election in Denmark
| Parties | Vote | |||||
|---|---|---|---|---|---|---|
| Votes | % | + / - | ||||
| Green Left | 4,522 | 24.67 | +10.53 | |||
| Social Democrats | 3,905 | 21.30 | -13.31 | |||
| People's Movement against the EU | 2,390 | 13.04 | +3.08 | |||
| Danish People's Party | 2,343 | 12.78 | +6.02 | |||
| Venstre | 1,795 | 9.79 | +1.70 | |||
| Conservatives | 1,460 | 7.96 | +0.75 | |||
| Social Liberals | 1,243 | 6.78 | -1.10 | |||
| June Movement | 539 | 2.94 | -7.83 | |||
| Liberal Alliance | 134 | 0.73 | New | |||
| Total | 18,331 | |||||
| Source[46] | ||||||
2004 European Parliament election in Denmark
| Parties | Vote | |||||
|---|---|---|---|---|---|---|
| Votes | % | + / - | ||||
| Social Democrats | 3,964 | 34.61 | +17.62 | |||
| Green Left | 1,620 | 14.14 | +2.37 | |||
| June Movement | 1,233 | 10.77 | -9.96 | |||
| People's Movement against the EU | 1,141 | 9.96 | -2.69 | |||
| Venstre | 926 | 8.09 | -3.33 | |||
| Social Liberals | 903 | 7.88 | -1.05 | |||
| Conservatives | 826 | 7.21 | +1.51 | |||
| Danish People's Party | 774 | 6.76 | -1.25 | |||
| Christian Democrats | 66 | 0.58 | -0.56 | |||
| Total | 11,453 | |||||
| Source[47] | ||||||
1999 European Parliament election in Denmark
| Parties | Vote | |||||
|---|---|---|---|---|---|---|
| Votes | % | + / - | ||||
| June Movement | 2,580 | 20.73 | -0.39 | |||
| Social Democrats | 2,114 | 16.99 | -1.41 | |||
| People's Movement against the EU | 1,574 | 12.65 | -5.28 | |||
| Green Left | 1,465 | 11.77 | -0.32 | |||
| Venstre | 1,421 | 11.42 | +4.16 | |||
| Social Liberals | 1,112 | 8.93 | +1.79 | |||
| Danish People's Party | 997 | 8.01 | New | |||
| Conservatives | 709 | 5.70 | -6.30 | |||
| Centre Democrats | 332 | 2.67 | +1.89 | |||
| Christian Democrats | 142 | 1.14 | +0.53 | |||
| Progress Party | 59 | 0.47 | -2.21 | |||
| Total | 12,446 | |||||
| Source[48] | ||||||
1994 European Parliament election in Denmark
| Parties | Vote | |||||
|---|---|---|---|---|---|---|
| Votes | % | + / - | ||||
| June Movement | 2,788 | 21.12 | New | |||
| Social Democrats | 2,429 | 18.40 | -10.00 | |||
| People's Movement against the EU | 2,367 | 17.93 | -14.01 | |||
| Green Left | 1,596 | 12.09 | -2.00 | |||
| Conservatives | 1,584 | 12.00 | +3.27 | |||
| Venstre | 958 | 7.26 | +2.04 | |||
| Social Liberals | 942 | 7.14 | +5.43 | |||
| Progress Party | 354 | 2.68 | -1.04 | |||
| Centre Democrats | 103 | 0.78 | -4.27 | |||
| Christian Democrats | 80 | 0.61 | -0.53 | |||
| Total | 13,201 | |||||
| Source[49] | ||||||
1989 European Parliament election in Denmark
| Parties | Vote | |||||
|---|---|---|---|---|---|---|
| Votes | % | + / - | ||||
| People's Movement against the EU | 4,220 | 31.94 | +0.60 | |||
| Social Democrats | 3,752 | 28.40 | +2.66 | |||
| Green Left | 1,862 | 14.09 | -1.93 | |||
| Conservatives | 1,154 | 8.73 | -3.90 | |||
| Venstre | 690 | 5.22 | +3.28 | |||
| Centre Democrats | 667 | 5.05 | +1.02 | |||
| Progress Party | 491 | 3.72 | +0.83 | |||
| Social Liberals | 226 | 1.71 | -0.15 | |||
| Christian Democrats | 150 | 1.14 | -0.14 | |||
| Total | 13,212 | |||||
| Source[50] | ||||||
1984 European Parliament election in Denmark
| Parties | Vote | |||||
|---|---|---|---|---|---|---|
| Votes | % | |||||
| People's Movement against the EU | 4,700 | 31.34 | ||||
| Social Democrats | 3,861 | 25.74 | ||||
| Green Left | 2,403 | 16.02 | ||||
| Conservatives | 1,894 | 12.63 | ||||
| Centre Democrats | 605 | 4.03 | ||||
| Progress Party | 433 | 2.89 | ||||
| Left Socialists | 341 | 2.27 | ||||
| Venstre | 291 | 1.94 | ||||
| Social Liberals | 279 | 1.86 | ||||
| Christian Democrats | 192 | 1.28 | ||||
| Total | 14,999 | |||||
| Source[51] | ||||||
Referendums
2022 Danish European Union opt-out referendum[52]
| Option | Votes | % |
|---|---|---|
| ✓ YES | 16,844 | 67.83 |
| X NO | 7,987 | 32.17 |
2015 Danish European Union opt-out referendum[53]
| Option | Votes | % |
|---|---|---|
| X NO | 12,830 | 54.18 |
| ✓ YES | 10,852 | 45.82 |
2014 Danish Unified Patent Court membership referendum[54]
| Option | Votes | % |
|---|---|---|
| ✓ YES | 10,430 | 56.33 |
| X NO | 8,085 | 43.67 |
2009 Danish Act of Succession referendum[55]
| Option | Votes | % |
|---|---|---|
| ✓ YES | 12,991 | 83.59 |
| X NO | 2,551 | 16.41 |
2000 Danish euro referendum[56]
| Option | Votes | % |
|---|---|---|
| X NO | 13,592 | 62.19 |
| ✓ YES | 8,265 | 37.81 |
1998 Danish Amsterdam Treaty referendum[57]
| Option | Votes | % |
|---|---|---|
| X NO | 10,887 | 57.40 |
| ✓ YES | 8,081 | 42.60 |
1993 Danish Maastricht Treaty referendum[58]
| Option | Votes | % |
|---|---|---|
| X NO | 12,956 | 59.44 |
| ✓ YES | 8,839 | 40.56 |
1992 Danish Maastricht Treaty referendum[59]
| Option | Votes | % |
|---|---|---|
| X NO | 14,128 | 65.96 |
| ✓ YES | 7,292 | 34.04 |
1986 Danish Single European Act referendum[60]
| Option | Votes | % |
|---|---|---|
| X NO | 13,806 | 67.75 |
| ✓ YES | 6,573 | 32.25 |
1972 Danish European Communities membership referendum[61]
| Option | Votes | % |
|---|---|---|
| X NO | 15,135 | 53.30 |
| ✓ YES | 13,262 | 46.70 |
1953 Danish constitutional and electoral age referendum[62]
| Option | Votes | % |
|---|---|---|
| ✓ YES | 26,864 | 75.71 |
| X NO | 8,618 | 24.29 |
| 21 years | 20,722 | 56.83 |
| 23 years | 15,742 | 43.17 |
1939 Danish constitutional referendum[63]
| Option | Votes | % |
|---|---|---|
| ✓ YES | 31,652 | 97.14 |
| X NO | 933 | 2.86 |
References
- "Valbykredsen". kmdvalg.dk (in Danish). Retrieved 2023-06-08.
- "Forslag til Lov om Valg til Rigsdagen". Rigsdagstidende. 1894–95: Tillæg C, spalte 7 ff.
- "Nye valgkredse fordeler stemmerne anderledes". dr.dk (in Danish). Retrieved 2023-06-08.
- "Beretning om nye valgkredse som følge af kommunalreformen" (in Danish). Retrieved 2023-06-08.
- "Det danske valgsystem: Valg til Folketinget". valg.im (in Danish). Retrieved 2023-06-08.
- "8 Valby". dataforsyningen.dk (in Danish). Retrieved 2023-06-08.
- "Forslag til Lov om Valg til Rigsdagen". Rigsdagstidende. 1894–95: Tillæg C, spalte 7 ff.
- "Forslag til Lov om Valg til Rigsdagen". Rigsdagstidende. 1952-53 (første samling): Tillæg C, spalte 225 ff.
- "Forslagn til Lov om ændring af lov om valg til Folketinget" (PDF). Folketingstidende. 4 June 1970.
- "Valgresultater fra tidligere valg:". kmdvalg (in Danish). Retrieved 2023-06-08.
- "FOLKETINGSVALG TIRSDAG 1. NOVEMBER 2022". valg.im (in Danish). Retrieved 2023-06-27.
- "FOLKETINGSVALG ONSDAG 5. JUNI 2019". valg.im (in Danish). Retrieved 2023-06-27.
- "FOLKETINGSVALG TORSDAG 18. JUNI 2015". valg.im (in Danish). Retrieved 2023-06-27.
- "FOLKETINGSVALG TORSDAG 15. SEPTEMBER 2011". valg.im (in Danish). Retrieved 2023-06-27.
- "Folketingsvalget den 13. november 2007". valg.im (in Danish). Retrieved 2023-06-27.
- "valg2005.book" (PDF). valg.im (in Danish). Retrieved 2023-06-27.
- "BMTABEL" (PDF). valg.im (in Danish). Retrieved 2023-06-27.
- "VALG98" (PDF). valg.im (in Danish). Retrieved 2023-06-27.
- "VALG94" (PDF). valg.im (in Danish). Retrieved 2023-06-27.
- "VALG90" (PDF). valg.im (in Danish). Retrieved 2023-06-27.
- "Folketingsvalget den 10. maj 1988". valg.im (in Danish). Retrieved 2023-06-27.
- "Folketingsvalget den 8.september 1987". dst.dk (in Danish). Retrieved 2023-06-27.
- "Folketingsvalget den 10. januar 1984". dst.dk (in Danish). Retrieved 2023-06-27.
- "Folketingsvalget den 8. december 1981". dst.dk (in Danish). Retrieved 2023-06-27.
- "Folketingsvalget den 23. oktober 1979". dst.dk (in Danish). Retrieved 2023-06-27.
- "Folketingsvalget den 15. februar 1977". dst.dk (in Danish). Retrieved 2023-06-27.
- "Folketingsvalget den 9. januar 1975". dst.dk (in Danish). Retrieved 2023-06-27.
- "Folketingsvalget den 4. december 1973". dst.dk (in Danish). Retrieved 2023-06-27.
- "Folketingsvalget den 21. september 1971 samt folkeafstemningen". dst.dk (in Danish). Retrieved 2023-06-27.
- "Rigsdagsvalgene og folkeafstemningerne i april og maj 1953". dst.dk (in Danish). Retrieved 2023-06-27.
- "Folketingsvalget den 5. september 1950". dst.dk (in Danish). Retrieved 2023-06-27.
- "Folketingsvalget den 28. oktober 1947". dst.dk (in Danish). Retrieved 2023-06-27.
- "Rigsdagsvalgene i oktober og november 1945". dst.dk (in Danish). Retrieved 2023-06-27.
- "Rigsdagsvalgene i marts og april 1943". dst.dk (in Danish). Retrieved 2023-06-27.
- "Rigsdagsvalgene og Folkeafstemningen i april og maj 1939". dst.dk (in Danish). Retrieved 2023-06-27.
- "Folketingsvalget den 22. oktober 1935". dst.dk (in Danish). Retrieved 2023-06-27.
- "Folketingsvalget den 16. november 1932". dst.dk (in Danish). Retrieved 2023-06-27.
- "Folketingsvalget den 24. april 1929". dst.dk (in Danish). Retrieved 2023-06-27.
- "Folketingsvalget den 2. december 1926". dst.dk (in Danish). Retrieved 2023-06-27.
- "Folketingsvalget den 11. april 1924". dst.dk (in Danish). Retrieved 2023-06-27.
- "Rigsdagsvalgene september-oktober 1920". dst.dk (in Danish). Retrieved 2023-06-27.
- "Rigsdagsvalgene juli-august 1920". dst.dk (in Danish). Retrieved 2023-06-27.
- "Folketingsvalget den 26. april 1920". dst.dk (in Danish). Retrieved 2023-06-27.
- "EUROPA-PARLAMENTSVALG SØNDAG 26. MAJ 2019". dst.dk (in Danish). Retrieved 2023-07-01.
- "EUROPA-PARLAMENTSVALG SØNDAG 25. MAJ 2014". dst.dk (in Danish). Retrieved 2023-07-01.
- "EUROPA-PARLAMENTSVALG SØNDAG 7. JUNI 2009". dst.dk (in Danish). Retrieved 2023-07-01.
- "EUROPA-PARLAMENTSVALGET DEN 13. JUNI 2004" (PDF). im.dk (in Danish). Retrieved 2023-07-01.
- "VALGET TIL EUROPA-PARLAMENTET DEN 10. JUNI 1999" (PDF). im.dk (in Danish). Retrieved 2023-07-01.
- "VALGET TIL EUROPA-PARLAMENTET DEN 9. JUNI 1994" (PDF). im.dk (in Danish). Retrieved 2023-07-01.
- "Valget til Europa-parlamentet den 15. juni 1989". dst.dk (in Danish). Retrieved 2023-07-01.
- "Valget til Europa-Parlamentet den 14. juni 1984". dst.dk (in Danish). Retrieved 2023-07-01.
- "FOLKEAFSTEMNING ONSDAG 1. JUNI 2022". dst.dk (in Danish). Retrieved 2023-07-05.
- "FOLKEAFSTEMNING TORSDAG 3. DECEMBER 2015". dst.dk (in Danish). Retrieved 2023-07-05.
- "FOLKEAFSTEMNING SØNDAG 25. MAJ 2014". dst.dk (in Danish). Retrieved 2023-07-05.
- "FOLKEAFSTEMNING SØNDAG 7. JUNI 2009". dst.dk (in Danish). Retrieved 2023-07-05.
- "FOLKEAFSTEMNINGEN DEN 28. SEPTEMBER 2000 OM DANMARKS DELTAGELSE I DEN FÆLLES VALUTA" (PDF). valg.im (in Danish). Retrieved 2023-07-05.
- "FOLKEAFSTEMNINGEN DEN 28. MAJ 1998OM DANMARKS TILTRÆDELSE AF AMSTERDAMTRAKTATEN" (PDF). valg.im (in Danish). Retrieved 2023-07-05.
- "FOLKEAFSTEMNINGEN DEN 18. MAJ 1993 OM DANMARKS TILTRÆDELSE AF EDINBURGH-AFGØRELSEN OG MAASTRICHT-TRAKTATEN". dst.dk (in Danish). Retrieved 2023-07-05.
- "Folkeafstemningen den 1. juni 1992 om Danmarks tiltrædelse af traktaten om Den Europæiske Union". dst.dk (in Danish). Retrieved 2023-07-05.
- "Vejledende folkeafstemning torsdag den 27. februar 1986 om Danmarks tiltrædelse af EF- pakken". dst.dk (in Danish). Retrieved 2023-07-05.
- "Folkeafstemningen om Danmarks tiltrædelse af De europæiske Fælleskaber 2. oktober 1972". dst.dk (in Danish). Retrieved 2023-07-05.
- "Publikationsfortegnelse vedrørende Folkeafstemninger". dst.dk (in Danish). Retrieved 2023-07-05.
- "Publikationsfortegnelse vedrørende Folkeafstemninger". dst.dk (in Danish). Retrieved 2023-07-05.