Venise-en-Québec
Venise-en-Québec (French pronunciation: [vəniz ɑ̃ kebɛk]) is a municipality in the province of Quebec, Canada, located at the north end of Lake Champlain in the Regional County Municipality of Le Haut-Richelieu. The population as of the Canada 2021 Census was 1,899.
Venise-en-Québec | |
|---|---|
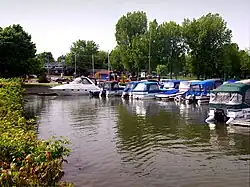 Marina of Venise-en-Québec | |
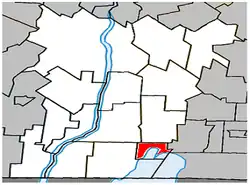 Location within Le Haut-Richelieu RCM | |
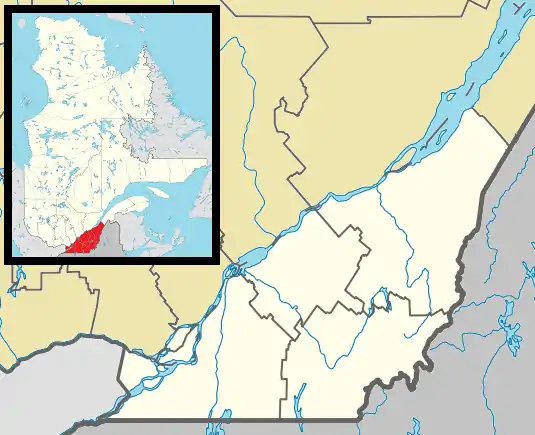 Venise-en-Québec Location in southern Quebec | |
| Coordinates: 45°05′N 73°08′W[1] | |
| Country | |
| Province | |
| Region | Montérégie |
| RCM | Le Haut-Richelieu |
| Constituted | January 1, 1950 |
| Government | |
| • Mayor | Jacques Landry |
| • Federal riding | Brome—Missisquoi |
| • Prov. riding | Iberville |
| Area | |
| • Total | 20.30 km2 (7.84 sq mi) |
| • Land | 13.13 km2 (5.07 sq mi) |
| Population (2021)[4] | |
| • Total | 1,899 |
| • Density | 144.7/km2 (375/sq mi) |
| • Pop 2016-2021 | |
| • Dwellings | 1,173 |
| Time zone | UTC−5 (EST) |
| • Summer (DST) | UTC−4 (EDT) |
| Postal code(s) | |
| Area code(s) | 450 and 579 |
| Highways | |
| Website | veniseenquebec |
Demographics
Population
Canada census – Venise-en-Québec community profile
| 2021 | 2016 | 2011 | |
|---|---|---|---|
| Population | 1,899 (+16.2% from 2016) | 1,634 (+5.6% from 2011) | 1,547 (+17.3% from 2006) |
| Land area | 13.13 km2 (5.07 sq mi) | 13.23 km2 (5.11 sq mi) | 13.24 km2 (5.11 sq mi) |
| Population density | 144.7/km2 (375/sq mi) | 123.5/km2 (320/sq mi) | 116.9/km2 (303/sq mi) |
| Median age | 59.2 (M: 60.0, F: 58.8) | 58.2 (M: 58.2, F: 58.3) | 55.1 (M: 54.1, F: 56.2) |
| Private dwellings | 1,173 (total) | 1,099 (total) | 1,036 (total) |
| Median household income | $68,000 | $53,931 | $49,988 |
| Year | Pop. | ±% |
|---|---|---|
| 1951 | 173 | — |
| 1956 | 197 | +13.9% |
| 1961 | 264 | +34.0% |
| 1966 | 291 | +10.2% |
| 1971 | 502 | +72.5% |
| 1976 | 628 | +25.1% |
| 1981 | 810 | +29.0% |
| 1986 | 791 | −2.3% |
| 1991 | 934 | +18.1% |
| 1996 | 1,108 | +18.6% |
| 2001 | 1,243 | +12.2% |
| 2006 | 1,319 | +6.1% |
| 2011 | 1,547 | +17.3% |
| 2016 | 1,634 | +5.6% |
| 2021 | 1,899 | +16.2% |
Language
| Canada Census Mother Tongue - Venise-en-Québec, Quebec[10] | ||||||||||||||||||
|---|---|---|---|---|---|---|---|---|---|---|---|---|---|---|---|---|---|---|
| Census | Total | French |
English |
French & English |
Other | |||||||||||||
| Year | Responses | Count | Trend | Pop % | Count | Trend | Pop % | Count | Trend | Pop % | Count | Trend | Pop % | |||||
2021 |
1,895 |
1,720 | 90.8% | 110 | 5.8% | 25 | 1.3% | 40 | 2.1% | |||||||||
2016 |
1,625 |
1,455 | 89.5% | 110 | 6.8% | 10 | 0.6% | 45 | 2.8% | |||||||||
2011 |
1,540 |
1,350 | 87.7% | 120 | 7.8% | 25 | 1.6% | 45 | 2.9% | |||||||||
2006 |
1,310 |
1,160 | 88.6% | 85 | 6.5% | 0 | 0.0% | 65 | 5.0% | |||||||||
2001 |
1,245 |
1,050 | 84.3% | 140 | 11.3% | 10 | 0.8% | 45 | 3.6% | |||||||||
1996 |
1,105 |
980 | n/a | 88.7% | 95 | n/a | 8.6% | 30 | n/a | 2.7% | 0 | n/a | 0.0% | |||||
See also
References
- "Reference number 65335 in Banque de noms de lieux du Québec". toponymie.gouv.qc.ca (in French). Commission de toponymie du Québec.
- "Ministère des Affaires municipales, des Régions et de l'Occupation du territoire: Venise-en-Québec". Archived from the original on 2014-08-26. Retrieved 2014-08-17.
- Parliament of Canada Federal Riding History: BROME--MISSISQUOI (Quebec)
- 2021 Statistics Canada Census Profile: Venise-en-Québec, Quebec
- "2021 Community Profiles". 2021 Canadian Census. Statistics Canada. February 4, 2022. Retrieved 2022-08-23.
- "2016 Community Profiles". 2016 Canadian Census. Statistics Canada. August 12, 2021. Retrieved 2022-06-29.
- "2011 Community Profiles". 2011 Canadian Census. Statistics Canada. March 21, 2019. Retrieved 2014-04-06.
- "2006 Community Profiles". 2006 Canadian Census. Statistics Canada. August 20, 2019.
- "2001 Community Profiles". 2001 Canadian Census. Statistics Canada. July 18, 2021.
- Statistics Canada: 1996, 2001, 2006, 2011, 2016, 2021 census
External links
 Media related to Venise-en-Québec at Wikimedia Commons
- Venise-en-Québec official website
Adjacent Municipal Subdivisions | ||||||||||||||||
|---|---|---|---|---|---|---|---|---|---|---|---|---|---|---|---|---|
| ||||||||||||||||
| Cities & Towns | |
|---|---|
| Municipalities | |
| Parishes | |
| |
This article is issued from Wikipedia. The text is licensed under Creative Commons - Attribution - Sharealike. Additional terms may apply for the media files.