Vilhelmina
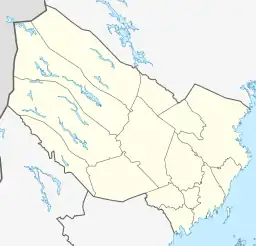
Vilhelmina (Southern Sami: Vualtjere) is a locality and the seat of Vilhelmina Municipality in Västerbotten County, province of Lapland, Sweden with 3,657 inhabitants in 2010.[1]
Vilhelmina
Vualtjere | |
|---|---|
 Vilhelmina's town center | |
 Vilhelmina 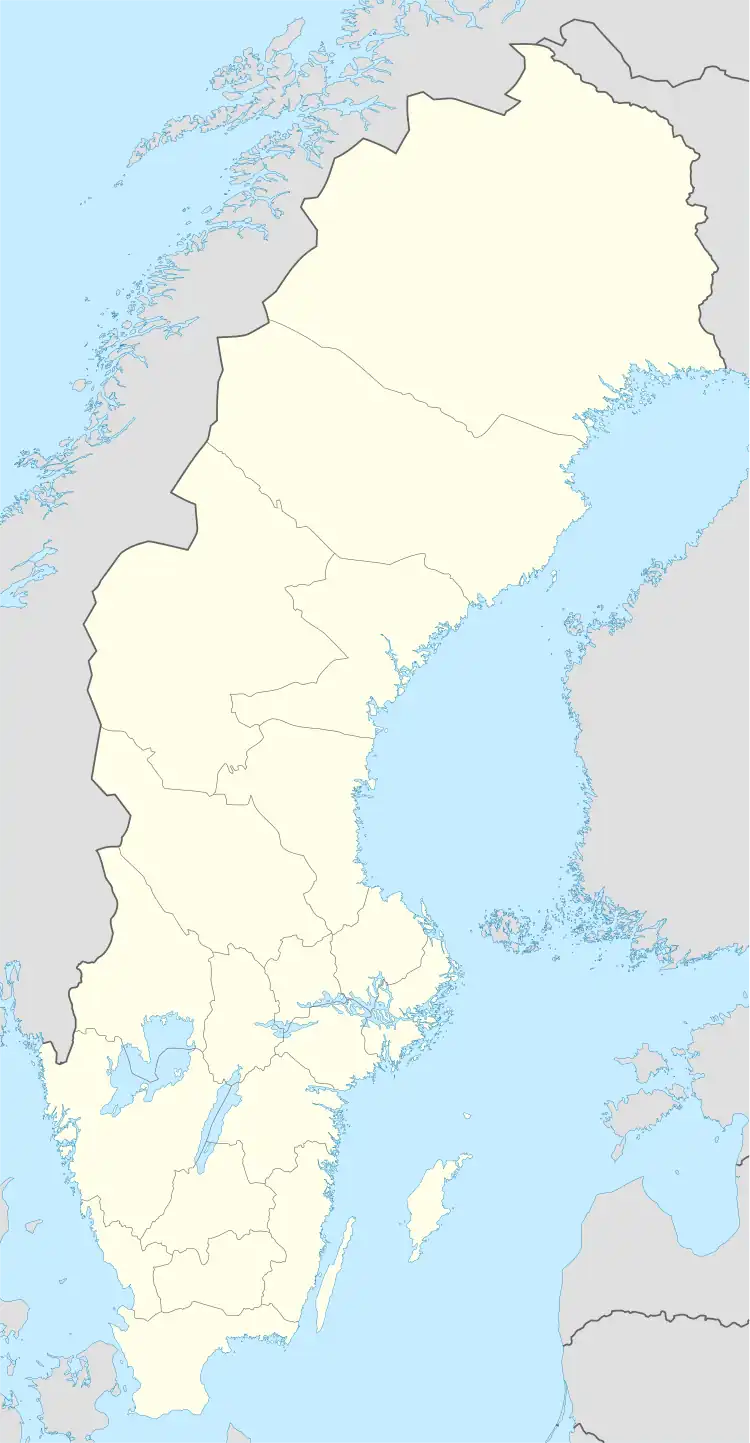 Vilhelmina | |
| Coordinates: 64°37′N 16°39′E | |
| Country | Sweden |
| Province | Lapland |
| County | Västerbotten County |
| Municipality | Vilhelmina Municipality |
| Area | |
| • Total | 3.54 km2 (1.37 sq mi) |
| Population (31 December 2010)[1] | |
| • Total | 3,657 |
| • Density | 1,033/km2 (2,680/sq mi) |
| Time zone | UTC+1 (CET) |
| • Summer (DST) | UTC+2 (CEST) |
| Postal code | 8376 |
| Website | www |
Climate
Vilhelmina has a subarctic climate that is less severe than typical for a far inland locality at this latitude, but still very cold by Swedish standards. Its higher altitude causes summers to be cooler than coastal areas like Skellefteå further east, whereas winters are somewhat tempered by maritime air from the greater Atlantic and the North Atlantic Current.
| Climate data for Vilhelmina (2002–2022 averages); extremes since 1995 | |||||||||||||
|---|---|---|---|---|---|---|---|---|---|---|---|---|---|
| Month | Jan | Feb | Mar | Apr | May | Jun | Jul | Aug | Sep | Oct | Nov | Dec | Year |
| Record high °C (°F) | 7.1 (44.8) |
6.8 (44.2) |
12.2 (54.0) |
18.6 (65.5) |
26.6 (79.9) |
30.3 (86.5) |
31.2 (88.2) |
29.2 (84.6) |
24.4 (75.9) |
20.2 (68.4) |
11.6 (52.9) |
8.1 (46.6) |
31.2 (88.2) |
| Mean maximum °C (°F) | 2.8 (37.0) |
3.7 (38.7) |
7.1 (44.8) |
13.9 (57.0) |
22.0 (71.6) |
25.4 (77.7) |
27.0 (80.6) |
24.6 (76.3) |
18.8 (65.8) |
12.5 (54.5) |
6.3 (43.3) |
3.9 (39.0) |
28.0 (82.4) |
| Average high °C (°F) | −6.5 (20.3) |
−4.6 (23.7) |
0.5 (32.9) |
6.0 (42.8) |
12.5 (54.5) |
17.6 (63.7) |
20.4 (68.7) |
18.0 (64.4) |
12.3 (54.1) |
5.0 (41.0) |
−1.0 (30.2) |
−4.3 (24.3) |
6.3 (43.4) |
| Daily mean °C (°F) | −11.3 (11.7) |
−10.0 (14.0) |
−5.3 (22.5) |
0.7 (33.3) |
6.6 (43.9) |
11.7 (53.1) |
14.5 (58.1) |
12.4 (54.3) |
7.6 (45.7) |
1.2 (34.2) |
−4.5 (23.9) |
−8.6 (16.5) |
1.2 (34.3) |
| Average low °C (°F) | −16.0 (3.2) |
−15.3 (4.5) |
−11.1 (12.0) |
−4.6 (23.7) |
0.7 (33.3) |
5.7 (42.3) |
8.5 (47.3) |
6.7 (44.1) |
2.9 (37.2) |
−2.6 (27.3) |
−7.9 (17.8) |
−12.9 (8.8) |
−3.8 (25.1) |
| Mean minimum °C (°F) | −32.2 (−26.0) |
−31.1 (−24.0) |
−26.2 (−15.2) |
−14.9 (5.2) |
−6.5 (20.3) |
−1.4 (29.5) |
0.9 (33.6) |
−1.1 (30.0) |
−4.6 (23.7) |
−14.9 (5.2) |
−21.7 (−7.1) |
−27.9 (−18.2) |
−34.8 (−30.6) |
| Record low °C (°F) | −41.1 (−42.0) |
−40.2 (−40.4) |
−34.6 (−30.3) |
−24.9 (−12.8) |
−9.1 (15.6) |
−3.7 (25.3) |
−0.6 (30.9) |
−3.1 (26.4) |
−10.3 (13.5) |
−21.0 (−5.8) |
−29.9 (−21.8) |
−38.0 (−36.4) |
−41.1 (−42.0) |
| Average precipitation mm (inches) | 31.4 (1.24) |
25.4 (1.00) |
22.6 (0.89) |
23.7 (0.93) |
44.1 (1.74) |
51.6 (2.03) |
79.5 (3.13) |
69.9 (2.75) |
56.4 (2.22) |
48.7 (1.92) |
37.9 (1.49) |
33.3 (1.31) |
524.5 (20.65) |
| Source 1: SMHI Open Data[2] | |||||||||||||
| Source 2: SMHI Monthly Data 2002–2022[3] | |||||||||||||
References
Wikimedia Commons has media related to Vilhelmina.
- "Tätorternas landareal, folkmängd och invånare per km2 2005 och 2010" (in Swedish). Statistics Sweden. 14 December 2011. Archived from the original on 27 January 2012. Retrieved 10 January 2012.
- "Ladda ner meteorologiska observationer". Swedish Meteorological and Hydrological Institute (in Swedish).
- "Års- och månadsstatistik". Swedish Meteorological and Hydrological Institute (in Swedish). 19 February 2023.
Municipalities and seats of Västerbotten County | ||
|---|---|---|
| Municipalities | ||
| Municipal seats | ||
This article is issued from Wikipedia. The text is licensed under Creative Commons - Attribution - Sharealike. Additional terms may apply for the media files.