Washington's 5th congressional district
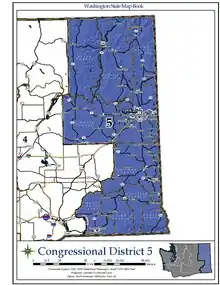
Washington's 5th congressional district encompasses the Eastern Washington counties of Ferry, Stevens, Pend Oreille, Lincoln, Spokane, Whitman, Walla Walla, Columbia, Garfield, and Asotin, along with parts of Adams and Franklin. It is centered on Spokane, the state's second largest city.
| Washington's 5th congressional district | |||
|---|---|---|---|
Interactive map of district boundaries since January 3, 2023. Points indicate major cities in the district (Spokane, Spokane Valley, Pullman, and Walla Walla respectively). | |||
| Representative |
| ||
| Population (2022) | 785,349 | ||
| Median household income | $67,085[1] | ||
| Ethnicity |
| ||
| Cook PVI | R+8[2] | ||
Since 2005, the 5th district has been represented in the U.S. House of Representatives by Cathy McMorris Rodgers, a Republican. Rodgers's predecessor, George Nethercutt, defeated Democrat Tom Foley, then Speaker of the House, in the 1994 elections; Foley had held the seat since 1965.
In presidential elections, the 5th district was once fairly competitive, but in recent years has generally been a safe bet for the Republicans. Although George W. Bush carried the district with 57% in 2000 and 2004, John McCain just narrowly won the district with 52% of the vote, while Barack Obama received 46% in 2008. In 2012, President Obama's share of the vote dropped to 44%.
The first election in the 5th district was in 1914, won by Democrat Clarence Dill. Following the 1910 census, Washington gained two seats in the U.S. House, from three to five, but did not reapportion for the 1912 election. The two new seats were elected as statewide at-large, with each voter casting ballots for three congressional seats, their district and two at-large. After that election, the state was reapportioned to five districts for the 1914 election. The state's 6th district was added after the 1930 census and first contested in the 1932 election.
Recent results from presidential races
| Year | Office | Won district | Lost district | Winning margin |
|---|---|---|---|---|
| 1968 | President | Nixon 45% | Humphrey 41% | 4% |
| 1972 | President | Nixon 63% | McGovern 37% | 26% |
| 1976 | President | Ford 54% | Carter 43% | 11% |
| 1980 | President | Reagan 56% | Carter 34% | 22% |
| 1984 | President | Reagan 60% | Mondale 39% | 21% |
| 1988 | President | Bush 51% | Dukakis 48% | 3% |
| 1992 | President | Clinton 40% | Bush 36% | 4% |
| 1996 | President | Clinton 44% | Dole 43% | 1% |
| 2000 | President | Bush 55% | Gore 40% | 15% |
| 2004 | President | Bush 57% | Kerry 41% | 16% |
| 2008 | President | McCain 52% | Obama 46% | 6% |
| 2012 | President | Romney 54% | Obama 44% | 10% |
| 2016 | President | Trump 52% | Clinton 39% | 13% |
| 2020 | President | Trump 53% | Biden 44% | 9% |
List of members representing the district
Recent election results
2012
| Party | Candidate | Votes | % | |
|---|---|---|---|---|
| Republican | Cathy McMorris Rodgers (Incumbent) | 191,066 | 61.9 | |
| Democratic | Rich Cowan | 117,512 | 38.1 | |
| Total votes | 308,578 | 100.0 | ||
2014
| Party | Candidate | Votes | % | |
|---|---|---|---|---|
| Republican | Cathy McMorris Rodgers (incumbent) | 135,470 | 60.7 | |
| Democratic | Joseph Pakootas | 87,772 | 39.3 | |
| Total votes | 223,242 | 100.0 | ||
| Republican hold | ||||
2016
| Party | Candidate | Votes | % | |
|---|---|---|---|---|
| Republican | Cathy McMorris Rodgers (incumbent) | 192,959 | 59.6 | |
| Democratic | Joe Pakootas | 130,575 | 40.4 | |
| Total votes | 323,534 | 100.0 | ||
| Republican hold | ||||
2018
| Party | Candidate | Votes | % | |
|---|---|---|---|---|
| Republican | Cathy McMorris Rodgers (incumbent) | 175,422 | 54.8 | |
| Democratic | Lisa Brown | 144,925 | 45.2 | |
| Total votes | 320,347 | 100.0 | ||
| Republican hold | ||||
2020
| Party | Candidate | Votes | % | |
|---|---|---|---|---|
| Republican | Cathy McMorris Rodgers (incumbent) | 247,815 | 61.3 | |
| Democratic | Dave Wilson | 155,737 | 38.5 | |
| Write-in | 808 | 0.2 | ||
| Total votes | 404,360 | 100 | ||
| Republican hold | ||||
2022
| Party | Candidate | Votes | % | |
|---|---|---|---|---|
| Republican | Cathy McMorris Rodgers (incumbent) | 188,648 | 59.5 | |
| Democratic | Natasha Hill | 127,585 | 40.3 | |
| Write-in | 773 | 0.2 | ||
| Total votes | 317,006 | 100 | ||
| Republican hold | ||||
Historical district boundaries


See also
- United States House of Representatives elections in Washington, 2010
- United States House of Representatives elections in Washington, 2012
- United States House of Representatives elections in Washington, 2014
- United States House of Representatives elections in Washington, 2016
- United States House of Representatives elections in Washington, 2018
- United States House of Representatives elections in Washington, 2020
- United States House of Representatives elections in Washington, 2022
References
- "My Congressional District".
- "2022 Cook PVI: District Map and List". Cook Political Report. Retrieved January 10, 2023.
- "Hill elected to Congress". Spokane Daily Chronicle. September 26, 1923. p. 1.
- Reilly, W. Newland (July 19, 1943). "Leavy returns to preside over federal court". Spokane Daily Chronicle. p. 3.
- "Federal - All Results". Washington Secretary of State. Retrieved November 27, 2012.
- "Federal - All Results". Washington Secretary of State. November 4, 2014. Retrieved December 8, 2014.
- "November 8, 2016 General Election Results". Washington Secretary of State. Retrieved December 3, 2016.
- Johnson, Cheryl L. (February 28, 2019). "Statistics of the Congressional Election of November 6, 2018". Clerk of the U.S. House of Representatives. Retrieved April 27, 2019.
- "November 3, 2020 General Election Results". Washington Secretary of State. Retrieved December 4, 2020.
- Martis, Kenneth C. (1989). The Historical Atlas of Political Parties in the United States Congress. New York: Macmillan Publishing Company.
- Martis, Kenneth C. (1982). The Historical Atlas of United States Congressional Districts. New York: Macmillan Publishing Company.
- Congressional Biographical Directory of the United States 1774–present

.jpg.webp)
.jpg.webp)


.jpg.webp)
