Xunwu County
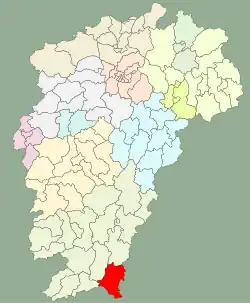
Xunwu County (simplified Chinese: 寻乌县; traditional Chinese: 尋烏縣; pinyin: Xúnwū Xiàn) is a county in the far south of Jiangxi province, People's Republic of China, bordering the provinces of Fujian to the east and Guangdong to the south. It is under the administration of the prefecture-level city of Ganzhou.
Xunwu
寻乌县 Sunwu | |
|---|---|
 Location in Jiangxi | |
| Coordinates: 24°57′47″N 115°38′49″E | |
| Country | People's Republic of China |
| Province | Jiangxi |
| Prefecture-level city | Ganzhou |
| Area | |
| • Total | 2,351 km2 (908 sq mi) |
| Population | |
| • Total | 331,934 (registered population in 2,018) |
| • Density | 141/km2 (370/sq mi) |
| Postal Code | 342200 |
It was the focus of Mao Zedong's 1930 essay Report from Xunwu which surveyed conditions in the region and related them to Mao's developing theory of Chinese communism.[1]
Administrative divisions
Xunwu County has 7 towns and 8 townships.[2]
- 7 towns
|
|
- 8 townships
|
|
Climate
| Climate data for Xunwu (1991–2020 normals, extremes 1981–2010) | |||||||||||||
|---|---|---|---|---|---|---|---|---|---|---|---|---|---|
| Month | Jan | Feb | Mar | Apr | May | Jun | Jul | Aug | Sep | Oct | Nov | Dec | Year |
| Record high °C (°F) | 27.2 (81.0) |
30.3 (86.5) |
31.2 (88.2) |
33.9 (93.0) |
35.1 (95.2) |
37.1 (98.8) |
38.3 (100.9) |
37.8 (100.0) |
37.0 (98.6) |
35.5 (95.9) |
34.4 (93.9) |
28.1 (82.6) |
38.3 (100.9) |
| Average high °C (°F) | 15.2 (59.4) |
17.2 (63.0) |
19.9 (67.8) |
24.8 (76.6) |
28.3 (82.9) |
30.7 (87.3) |
32.9 (91.2) |
32.6 (90.7) |
30.6 (87.1) |
27.0 (80.6) |
22.4 (72.3) |
17.1 (62.8) |
24.9 (76.8) |
| Daily mean °C (°F) | 9.5 (49.1) |
11.8 (53.2) |
14.9 (58.8) |
19.9 (67.8) |
23.4 (74.1) |
25.9 (78.6) |
27.3 (81.1) |
26.8 (80.2) |
25.0 (77.0) |
21.0 (69.8) |
16.2 (61.2) |
11.0 (51.8) |
19.4 (66.9) |
| Average low °C (°F) | 5.8 (42.4) |
8.2 (46.8) |
11.5 (52.7) |
16.3 (61.3) |
20.0 (68.0) |
22.7 (72.9) |
23.4 (74.1) |
23.2 (73.8) |
21.2 (70.2) |
16.7 (62.1) |
11.8 (53.2) |
6.8 (44.2) |
15.6 (60.1) |
| Record low °C (°F) | −5.0 (23.0) |
−2.4 (27.7) |
−2.7 (27.1) |
5.1 (41.2) |
10.6 (51.1) |
14.6 (58.3) |
18.0 (64.4) |
18.0 (64.4) |
11.7 (53.1) |
5.2 (41.4) |
−1.6 (29.1) |
−5.3 (22.5) |
−5.3 (22.5) |
| Average precipitation mm (inches) | 64.6 (2.54) |
89.7 (3.53) |
167.1 (6.58) |
187.7 (7.39) |
238.4 (9.39) |
264.9 (10.43) |
162.3 (6.39) |
188.0 (7.40) |
100.9 (3.97) |
43.4 (1.71) |
52.9 (2.08) |
48.1 (1.89) |
1,608 (63.3) |
| Average precipitation days (≥ 0.1 mm) | 8.9 | 11.4 | 17.4 | 16.7 | 17.3 | 18.8 | 15.0 | 17.1 | 11.2 | 5.5 | 6.8 | 7.2 | 153.3 |
| Average snowy days | 0.4 | 0.3 | 0 | 0 | 0 | 0 | 0 | 0 | 0 | 0 | 0 | 0.2 | 0.9 |
| Average relative humidity (%) | 76 | 79 | 82 | 82 | 83 | 84 | 80 | 82 | 80 | 74 | 75 | 73 | 79 |
| Mean monthly sunshine hours | 110.9 | 91.2 | 81.0 | 94.2 | 114.4 | 128.1 | 206.1 | 188.2 | 171.2 | 172.8 | 150.3 | 140.6 | 1,649 |
| Percent possible sunshine | 33 | 28 | 22 | 25 | 28 | 31 | 49 | 47 | 47 | 49 | 46 | 43 | 37 |
| Source: China Meteorological Administration[3][4] | |||||||||||||
References
- Report from Xunwu. Stanford University: Stanford University Press. 1993. ISBN 978-0-8047-2182-0.
- "南京市-行政区划网 www.xzqh.org" (in Chinese). XZQH. Retrieved 2012-05-24.
- 中国气象数据网 – WeatherBk Data (in Simplified Chinese). China Meteorological Administration. Retrieved 28 June 2023.
- 中国气象数据网 (in Simplified Chinese). China Meteorological Administration. Retrieved 28 June 2023.
This article is issued from Wikipedia. The text is licensed under Creative Commons - Attribution - Sharealike. Additional terms may apply for the media files.