2009 flu pandemic table May 2009
This is a table containing the figures from the WHO Influenza A Situation Updates issued in May 2009 roughly once a day.[1] Where more than one update was issued in a day, the corresponding figures are from the last update that day. The table can by sorted by country, date of first confirmed case or date of first confirmed case by continent.
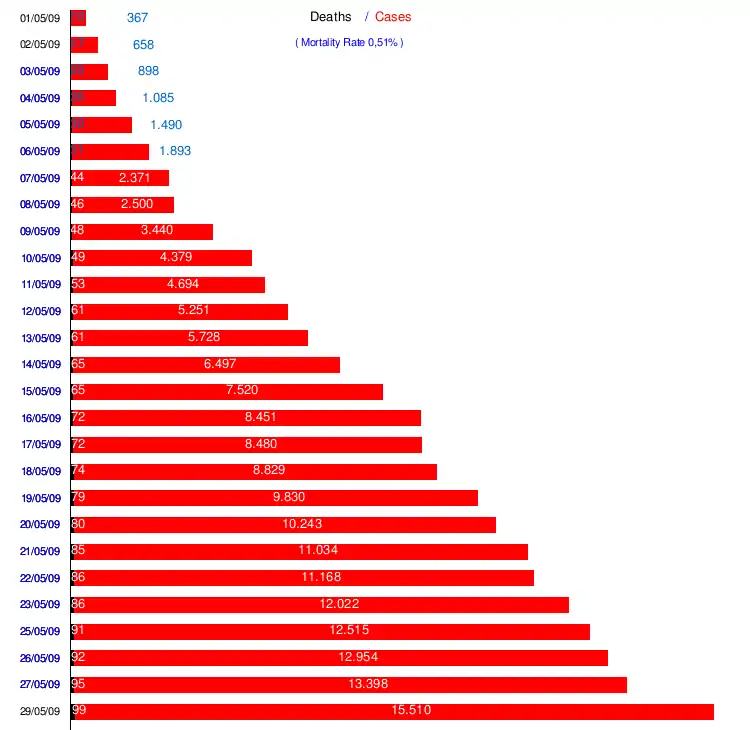
This presentation of the data in this and other tables shows the progression, peaks, and, eventually, decline of the epidemic in each country and continent.
Chart
| WHO figures chart of progression [2] |
 |
Confirmed cases
| By date | By cont. | Country | 1 | 2 | 3 | 4 | 5 | 6 | 7 | 8 | 9 | 10 | 11 | 12 | 13 | 14 | 15 | 16 | 17 | 18 | 19 | 20 | 21 | 22 | 23 | 25 | 26 | 27 | 29 |
|---|---|---|---|---|---|---|---|---|---|---|---|---|---|---|---|---|---|---|---|---|---|---|---|---|---|---|---|---|---|
| 0 | 0 | World | 367 | 658 | 898 | 1085 | 1490 | 1894 | 2371 | 2500 | 3440 | 4379 | 4694 | 5251 | 5728 | 6397 | 7520 | 8451 | 8480 | 8829 | 9830 | 10243 | 11034 | 11168 | 12021 | 12514 | 12950 | 13394 | 15501 |
| 0 | 0 | Days to double (approx) | 2 | 2 | 2 | 3 | 3 | 3 | 3 | 4 | 4 | 4 | 5 | 4 | 5 | 6 | 6 | 7 | 8 | 8 | 8 | 9 | 9 | 10 | 10 | 12 | 12 | 13 | 14 |
| 0 | 0 | Countries | 13 | 16 | 18 | 21 | 21 | 23 | 24 | 25 | 29 | 29 | 30 | 30 | 33 | 33 | 34 | 36 | 39 | 40 | 40 | 41 | 41 | 42 | 44 | 47 | 47 | 49 | 54 |
| 1 | 1.01 | 156 | 397 | 506 | 590 | 822 | 942 | 1112 | 1204 | 1364 | 1626 | 1626 | 2059 | 2059 | 2446 | 2446 | 2895 | 2895 | 3103 | 3648 | 3648 | 3892 | 3892 | 3892 | 4174 | 4174 | 4541 | 4910 | |
| 2 | 1.02 | 141 | 160 | 226 | 286 | 403 | 642 | 896 | 896 | 1639 | 2254 | 2532 | 2600 | 3009 | 3352 | 4298 | 4714 | 4714 | 4714 | 5123 | 5469 | 5710 | 5764 | 6552 | 6552 | 6764 | 6764 | 7927 | |
| 3 | 1.03 | 34 | 51 | 85 | 101 | 140 | 165 | 201 | 214 | 242 | 280 | 284 | 330 | 358 | 289 | 449 | 496 | 496 | 496 | 496 | 496 | 719 | 719 | 719 | 805 | 921 | 921 | 1118 | |
| 16 | 1.04 | 1 | 1 | 1 | 1 | 1 | 1 | 1 | 1 | 8 | 8 | 8 | 8 | 8 | 8 | 9 | 9 | 9 | 9 | 9 | 20 | 20 | 20 | 28 | 33 | 33 | 33 | ||
| 19 | 1.05 | 2 | 2 | 2 | 2 | 2 | 2 | 2 | 4 | 4 | 4 | 4 | 4 | 4 | 4 | 4 | 6 | 6 | 6 | 6 | 6 | 6 | 6 | 11 | 11 | ||||
| 22 | 1.06 | 1 | 1 | 1 | 1 | 1 | 1 | 1 | 3 | 3 | 3 | 3 | 3 | 3 | 3 | 3 | 4 | 4 | 4 | 4 | 4 | 5 | 5 | ||||||
| 27 | 1.07 | 2 | 3 | 15 | 16 | 29 | 29 | 40 | 43 | 54 | 54 | 59 | 65 | 69 | 73 | 76 | 76 | 76 | 76 | 107 | |||||||||
| 33 | 1.08 | 1 | 1 | 3 | 3 | 3 | 3 | 3 | 3 | 4 | 4 | 4 | 4 | 4 | 4 | 4 | |||||||||||||
| 46 | 1.09 | 1 | 1 | 1 | 1 | ||||||||||||||||||||||||
| 52 | 1.1 | 2 | |||||||||||||||||||||||||||
| 4 | 2.01 | 13 | 13 | 40 | 54 | 57 | 73 | 81 | 88 | 88 | 93 | 95 | 95 | 98 | 100 | 100 | 100 | 103 | 103 | 103 | 107 | 111 | 113 | 126 | 133 | 136 | 138 | 143 | |
| 7 | 2.02 | 8 | 15 | 15 | 18 | 27 | 28 | 32 | 34 | 34 | 39 | 47 | 55 | 68 | 71 | 71 | 78 | 82 | 101 | 102 | 102 | 109 | 112 | 117 | 122 | 137 | 137 | 203 | |
| 9 | 2.03 | 1 | 1 | 1 | 1 | 1 | 1 | 1 | 1 | 1 | 1 | 1 | 1 | 1 | 1 | 1 | 1 | 1 | 1 | 1 | 1 | 1 | 1 | 1 | 1 | 1 | 1 | 1 | |
| 8 | 2.04 | 4 | 6 | 8 | 8 | 9 | 9 | 10 | 11 | 11 | 11 | 11 | 12 | 12 | 12 | 12 | 14 | 14 | 14 | 14 | 14 | 14 | 14 | 17 | 17 | 17 | 17 | 19 | |
| 10 | 2.05 | 1 | 1 | 1 | 1 | 1 | 1 | 2 | 3 | 3 | 3 | 3 | 3 | 3 | 3 | 3 | 3 | 3 | 3 | 3 | 3 | 3 | 3 | 3 | 3 | 3 | 3 | 3 | |
| 11 | 2.06 | 1 | 1 | 1 | 1 | 1 | 1 | 1 | 1 | 1 | 1 | 1 | 1 | 1 | 1 | 1 | 1 | 1 | 1 | 1 | 1 | 1 | 1 | 2 | 3 | 3 | 3 | 4 | |
| 13 | 2.07 | 1 | 1 | 1 | 1 | 1 | 1 | 1 | 1 | 1 | 1 | 1 | 1 | 1 | 1 | 1 | 1 | 1 | 1 | 1 | 1 | 1 | 1 | 1 | 1 | 1 | 1 | 1 | |
| 14 | 2.08 | 2 | 2 | 4 | 4 | 5 | 5 | 12 | 12 | 12 | 13 | 13 | 13 | 14 | 14 | 14 | 14 | 14 | 14 | 15 | 16 | 16 | 16 | 16 | 16 | 16 | 21 | ||
| 17 | 2.09 | 1 | 1 | 1 | 1 | 1 | 1 | 1 | 1 | 1 | 1 | 1 | 1 | 1 | 1 | 1 | 1 | 1 | 1 | 1 | 1 | 1 | 1 | 1 | 1 | 3 | |||
| 18 | 2.1 | 1 | 2 | 5 | 5 | 5 | 6 | 6 | 9 | 9 | 9 | 9 | 9 | 9 | 9 | 9 | 9 | 9 | 9 | 10 | 10 | 14 | 19 | 19 | 23 | 26 | |||
| 21 | 2.11 | 1 | 1 | 1 | 1 | 1 | 1 | 1 | 1 | 1 | 1 | 1 | 1 | 1 | 1 | 1 | 1 | 1 | 1 | 1 | 1 | 1 | 1 | 1 | 1 | ||||
| 23 | 2.12 | 1 | 1 | 1 | 1 | 1 | 2 | 2 | 2 | 2 | 2 | 2 | 3 | 3 | 3 | 3 | 3 | 3 | 3 | 3 | 3 | 3 | 4 | ||||||
| 24 | 2.13 | 1 | 1 | 1 | 1 | 1 | 1 | 1 | 1 | 1 | 1 | 1 | 1 | 1 | 2 | 2 | 2 | 2 | 3 | 3 | 3 | 4 | |||||||
| 30 | 2.14 | 2 | 2 | 2 | 2 | 2 | 2 | 2 | 2 | 2 | 2 | 3 | 3 | 4 | 4 | 4 | 4 | 4 | |||||||||||
| 31 | 2.15 | 2 | 2 | 2 | 2 | 2 | 2 | 2 | 2 | 2 | 2 | 2 | 2 | 2 | 2 | 3 | |||||||||||||
| 34 | 2.16 | 1 | 2 | 4 | 5 | 5 | 5 | 5 | 5 | 7 | 7 | 7 | 7 | 8 | |||||||||||||||
| 41 | 2.17 | 1 | 1 | 1 | 1 | 1 | 1 | 1 | 3 | ||||||||||||||||||||
| 43 | 2.18 | 1 | 1 | 2 | 2 | 2 | |||||||||||||||||||||||
| 47 | 2.19 | 1 | 1 | 1 | 1 | ||||||||||||||||||||||||
| 50 | 2.2 | 3 | |||||||||||||||||||||||||||
| 53 | 2.21 | 1 | |||||||||||||||||||||||||||
| 54 | 2.22 | 1 | |||||||||||||||||||||||||||
| 6 | 3.01 | 2 | 3 | 3 | 4 | 4 | 4 | 6 | 7 | 7 | 7 | 7 | 7 | 7 | 7 | 7 | 7 | 7 | 7 | 7 | 7 | 7 | 7 | 7 | 8 | 8 | 9 | 11 | |
| 12 | 3.02 | 1 | 1 | 1 | 1 | 1 | 1 | 1 | 1 | 1 | 1 | 2 | 2 | 3 | 4 | 4 | 4 | 5 | 6 | 7 | 7 | 8 | 11 | 11 | 15 | 20 | 22 | 30 | |
| 15 | 3.03 | 1 | 1 | 1 | 2 | 2 | 3 | 3 | 3 | 3 | 3 | 3 | 3 | 3 | 3 | 3 | 3 | 3 | 3 | 3 | 3 | 3 | 3 | 3 | 21 | 21 | 33 | ||
| 26 | 3.04 | 3 | 4 | 4 | 4 | 4 | 4 | 4 | 4 | 7 | 125 | 159 | 210 | 259 | 294 | 321 | 345 | 350 | 360 | 364 | |||||||||
| 32 | 3.05 | 2 | 2 | 2 | 2 | 2 | 2 | 2 | 2 | 2 | 2 | 2 | 2 | 2 | 2 | 2 | |||||||||||||
| 38 | 3.06 | 1 | 1 | 1 | 1 | 1 | 1 | 1 | 1 | 1 | 1 | 1 | |||||||||||||||||
| 37 | 3.07 | 2 | 2 | 2 | 2 | 2 | 2 | 2 | 2 | 2 | 2 | 2 | |||||||||||||||||
| 39 | 3.08 | 1 | 2 | 2 | 2 | 2 | 2 | 2 | 2 | 2 | 2 | 2 | |||||||||||||||||
| 42 | 3.09 | 1 | 1 | 1 | 2 | 2 | 6 | ||||||||||||||||||||||
| 44 | 3.10 | 1 | 1 | 4 | 4 | 4 | |||||||||||||||||||||||
| 45 | 3.11 | 18 | 18 | 18 | 18 | ||||||||||||||||||||||||
| 48 | 3.12 | 1 | 1 | ||||||||||||||||||||||||||
| 49 | 3.13 | 1 | 4 | ||||||||||||||||||||||||||
| 5 | 4.01 | 4 | 4 | 4 | 6 | 6 | 6 | 5 | 5 | 5 | 7 | 7 | 7 | 7 | 7 | 7 | 9 | 9 | 9 | 9 | 9 | 9 | 9 | 9 | 9 | 9 | 9 | 9 | |
| 29 | 4.02 | 1 | 1 | 1 | 1 | 1 | 1 | 1 | 1 | 1 | 1 | 1 | 1 | 3 | 7 | 12 | 16 | 19 | 39 | 147 | |||||||||
| 20 | 5.01 | 1 | 1 | 1 | 1 | 1 | 1 | 1 | 3 | 3 | 6 | 7 | 10 | 11 | 11 | 11 | 11 | 12 | 12 | 12 | 12 | 13 | 16 | 16 | 17 | ||||
| 25 | 5.02 | 4 | 6 | 6 | 8 | 8 | 8 | 8 | 8 | 8 | 8 | 8 | 8 | 9 | 9 | 9 | 10 | 10 | 10 | 11 | 15 | ||||||||
| 28 | 5.03 | 1 | 1 | 1 | 1 | 1 | 1 | 1 | 1 | 1 | 1 | 1 | 1 | 1 | 1 | 1 | 2 | 5 | 19 | 37 | |||||||||
| 35 | 5.04 | 1 | 1 | 1 | 1 | 1 | 1 | 8 | 8 | 10 | 24 | 28 | 32 | ||||||||||||||||
| 36 | 5.05 | 1 | 1 | 1 | 2 | 3 | 3 | 5 | 5 | 25 | 27 | 27 | 31 | ||||||||||||||||
| 40 | 5.06 | 1 | 4 | 5 | 5 | 24 | 24 | 44 | 74 | 86 | 165 | ||||||||||||||||||
| 51 | 5.07 | 2 | |||||||||||||||||||||||||||
Deaths
| By date | By cont. | Country | 1 | 2 | 3 | 5 | 6 | 8 | 9 | 10 | 11 | 13 | 15 | 17 | 18 | 19 | 20 | 21 | 22 | 25 | 26 | 27 | 29 |
|---|---|---|---|---|---|---|---|---|---|---|---|---|---|---|---|---|---|---|---|---|---|---|---|
| 0 | 0 | World | 10 | 17 | 20 | 26 | 31 | 46 | 48 | 49 | 53 | 61 | 65 | 72 | 74 | 79 | 80 | 85 | 86 | 91 | 92 | 95 | 99 |
| 0 | 0 | Countries | 2 | 2 | 2 | 2 | 2 | 2 | 3 | 4 | 4 | 4 | 4 | 4 | 4 | 4 | 4 | 4 | 4 | 4 | 4 | 4 | 4 |
| 1 | 1.01 | 9 | 16 | 19 | 25 | 29 | 44 | 45 | 45 | 48 | 56 | 60 | 66 | 68 | 72 | 72 | 75 | 75 | 80 | 80 | 83 | 85 | |
| 2 | 1.02 | 1 | 1 | 1 | 1 | 2 | 2 | 2 | 2 | 3 | 3 | 3 | 4 | 4 | 5 | 6 | 8 | 9 | 9 | 10 | 10 | 11 | |
| 3 | 1.03 | 1 | 1 | 1 | 1 | 1 | 1 | 1 | 1 | 1 | 1 | 1 | 1 | 1 | 1 | 2 | |||||||
| 4 | 1.04 | 1 | 1 | 1 | 1 | 1 | 1 | 1 | 1 | 1 | 1 | 1 | 1 | 1 | 1 |
This article is issued from Wikipedia. The text is licensed under Creative Commons - Attribution - Sharealike. Additional terms may apply for the media files.