List of cities in Israel
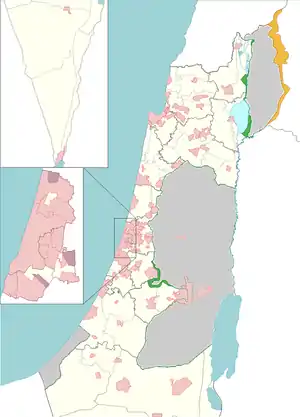
This list includes localities that are in Israel that the Israeli Ministry of Interior has designated as a city council. Jerusalem includes occupied East Jerusalem. The list is based on the current index of the Israel Central Bureau of Statistics (CBS). Within Israel's system of local government, an urban municipality can be granted a city council by the Interior Ministry when its population exceeds 20,000.[1] The term "city" does not generally refer to local councils or urban agglomerations, even though a defined city often contains only a small portion of an urban area or metropolitan area's population.
List
Israel has 16 cities with populations over 100,000, including Jerusalem and Tel Aviv-Yafo.[2] In all, there are 77 Israeli localities granted "municipalities" (or "city") status by the Ministry of the Interior, including four Israeli settlements in the West Bank.[3] Two more cities are planned: Kasif, a planned city to be built in the Negev, and Harish, originally a small town currently being built into a large city. The area and population of Jerusalem includes that of East Jerusalem which has been de facto annexed by Israel and incorporated within Jerusalem's municipal borders under the Jerusalem Law. This, however, is not recognized by the international community who regard East Jerusalem as part of the Occupied Palestinian Territory.[4][5] If East Jerusalem is considered part of Israel, Tel Aviv is the country's second most populous city with 452,000 residents after Jerusalem with 919,000; if not, Tel Aviv is the most populous city before West Jerusalem with around 350,000.
The following table lists all Israeli cities by name, district, population, and area, according to the Israel Central Bureau of Statistics:
| Name | Photo | District | First settlement |
Population estimate, 2019[6] |
Population census, 2008[7] |
Change, 2008– –2019 |
Area, km2 [8] |
Density, per km2 [9] |
Socio- economic index[10] |
|---|---|---|---|---|---|---|---|---|---|
| Acre[cbs 1] | 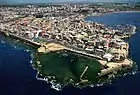 |
North | Bronze Age | 49,380 | 46,100 | +7.11% | 13.5 | 3,362.0 | −0.395 |
| Afula |  |
North | Bronze Age | 54,250 | 40,200 | +34.95% | 26.9 | 1,611.7 | −0.028 |
| Arad | 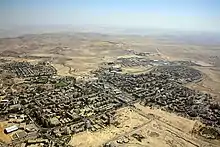 |
South | 1962 | 26,756 | 23,400 | +14.34% | 93.1 | 195.9 | 0.287 |
| Arraba[cbs 2] |  |
North | N/A | 25,833 | 20,600 | +25.40% | 8.25 | 3,097.1 | −0.945 |
| Ashdod | 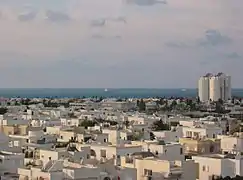 |
South | Bronze Age | 225,939 | 204,300 | +10.59% | 47.2 | 4,783.9 | −0.109 |
| Ashkelon[cbs 3] |  |
South | Neolithic | 144,073 | 110,600 | +30.26% | 47.8 | 2,964.8 | -0.032 |
| Baqa al-Gharbiyye |  |
Haifa | Middle Ages | 29,950 | N/A | N/A | 16.4 | 3,152.1 | −0.736 |
| Bat Yam |  |
Tel Aviv | 1926 | 129,013 | 130,300 | −0.99% | 8.2 | 15,758.4 | −0.025 |
| Beersheba[cbs 4] | 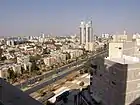 |
South | 1900[note 1] | 209,687 | 193,400 | +8.42% | 117.5 | 1,751.7 | 0.035 |
| Beit She'an[cbs 5] | 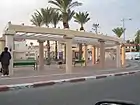 |
North | Neolithic | 18,464 | 16,900 | +9.25% | 7.3 | 2,379.9 | −0.277 |
| Beit Shemesh[cbs 6] |  |
Jerusalem | 1950 | 124,957 | 72,700 | +71.88% | 34.3 | 2,866.6 | −1.149 |
| Bnei Brak[cbs 7] | 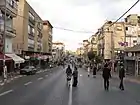 |
Tel Aviv | 1924 | 204,639 | 151,800 | +34.81% | 7.1 | 25,709.4 | −1.304 |
| Dimona | 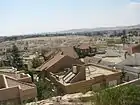 |
South | 1955 | 34,500 | 32,400 | +6.48% | 29.9 | 193.7 | −0.235 |
| Eilat[cbs 8] | 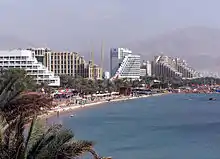 |
South | Neolithic | 52,299 | 47,300 | +10.57% | 84.8 | 509.6 | 0.247 |
| El'ad | 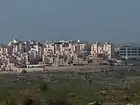 |
Center | 1998 | 48,763 | 33,900 | +43.84% | 2.8 | 13,138.6 | −1.493 |
| Giv'at Shmuel[cbs 9] | 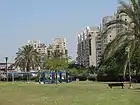 |
Center | 1944 | 26,578 | 21,000 | +26.56% | 2.6 | 9,978.1 | 1.124 |
| Givatayim[cbs 10] | .jpg.webp) |
Tel Aviv | 1922 | 60,644 | 52,100 | +16.40% | 3.3 | 18,058.2 | 1.417 |
| Hadera | 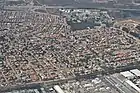 |
Haifa | 1891 | 97,335 | 79,400 | +22.59% | 49.4 | 1,809.2 | 0.255 |
| Haifa |  |
Haifa | Antiquity | 285,316 | 264,300 | +7.95% | 63.7 | 4,331.4 | 0.652 |
| Herzliya[cbs 11] | 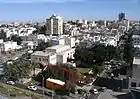 |
Tel Aviv | 1924 | 97,470 | 86,300 | +12.94% | 21.6 | 4,291.0 | 1.373 |
| Hod HaSharon | 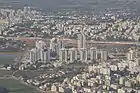 |
Center | 1924 | 63,175 | 46,300 | +36.45% | 21.6 | 3,058.9 | 1.485 |
| Holon | 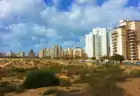 |
Tel Aviv | 1935 | 196,282 | 176,300 | +11.33% | 18.9 | 10,017.7 | 0.509 |
| Jerusalem | -Aerial-Temple_Mount-(south_exposure).jpg.webp) |
Jerusalem | Neolithic | 936,425 | 759,700 | +23.26% | 125.2 | 7,014.1 | −0.802 |
| Kafr Qasim[cbs 12] | 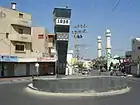 |
Center | 19th century | 23,823 | 18,400 | +29.47% | 8.7 | 2,391.5 | −0.841 |
| Karmiel[cbs 13] | 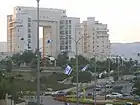 |
North | 1964 | 46,252 | 44,200 | +4.64% | 19.2 | 2,056.3 | 0.309 |
| Kfar Saba[cbs 14] |  |
Center | 1903 | 101,432 | 82,800 | +22.50% | 14.2 | 6,831.0 | 1.191 |
| Kfar Yona[cbs 15] |  |
Center | 1932 | 24,778 | 16,500 | +50.17% | 11.0 | 1,962.4 | 0.786 |
| Kiryat Ata[cbs 16] |  |
Haifa | 1925 | 59,030 | 50,400 | +17.12% | 16.7 | 3,253.0 | 0.249 |
| Kiryat Bialik[cbs 17] | 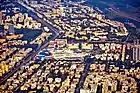 |
Haifa | 1934 | 40,231 | 37,200 | +8.15% | 8.2 | 4,650.1 | 0.567 |
| Kiryat Gat[cbs 18] | 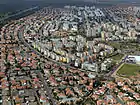 |
South | 1954 | 57,105 | 47,500 | +20.22% | 16.3 | 3,328.2 | −0.378 |
| Kiryat Malakhi[cbs 19] | 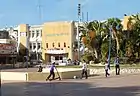 |
South | 1950 | 23,819 | 20,500 | +16.19% | 4.6 | 4,741.2 | −0.594 |
| Kiryat Motzkin[cbs 20] | 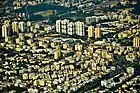 |
Haifa | 1934 | 43,303 | 38,100 | +13.66% | 3.8 | 10,612.0 | 0.590 |
| Kiryat Ono[cbs 21] | 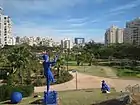 |
Tel Aviv | 1939 | 40,409 | 30,000 | +34.70% | 4.1 | 8,557.8 | 1.513 |
| Kiryat Shmona[cbs 22] | 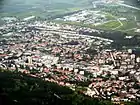 |
North | 1949 | 22,512 | 23,200 | −2.97% | 14.2 | 1,595.8 | −0.014 |
| Kiryat Yam[cbs 23] | 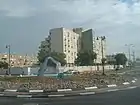 |
Haifa | 1941 | 39,897 | 37,700 | +5.83% | 4.3 | 8,568.6 | 0.018 |
| Lod | 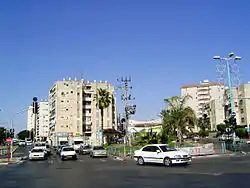 |
Center | Neolithic | 77,223 | 69,400 | +11.27% | 12.2 | 6,078.3 | −0.448 |
| Ma'alot-Tarshiha | 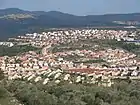 |
North | 1963 | 21,836 | 20,600 | +6.00% | 6.8 | 2,303.0 | 0.024 |
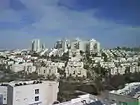
| Migdal HaEmek[cbs 24] | 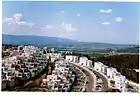 |
North | 1953 | 25,675 | 23,900 | +7.43% | 7.6 | 2,876.6 | −0.273 |
| Modi'in-Maccabim-Re'ut [cbs 25] |
 |
Center | 1985 | 93,277 | 69,300 | +34.60% | 50.2 | 1,862.5 | 1.351 |
| Nahariya[cbs 26] | 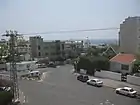 |
North | 1935 | 58,096 | 51,300 | +13.25% | 10.2 | 4,941.8 | 0.436 |
| Nazareth | 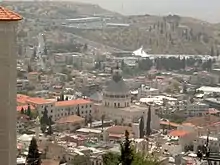 |
North | Bronze Age | 77,445 | 71,700 | +8.01% | 14.1 | 5,357.9 | −0.558 |
| Nesher | 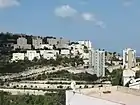 |
Haifa | 1923 | 24,148 | 23,300 | +3.64% | 12.8 | 1,828.9 | 0.783 |
| Ness Ziona[cbs 27] | 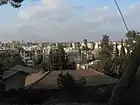 |
Center | 1883 | 50,351 | 36,100 | +39.48% | 15.6 | 3,071.5 | 1.265 |
| Netanya | 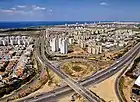 |
Center | 1929 | 221,353 | 180,100 | +22.91% | 29.0 | 6,807.7 | 0.240 |
| Netivot | .jpg.webp) |
South | 1956 | 37,542 | 26,100 | +43.84% | 5.6 | 2,874.7 | −0.760 |
| Nof HaGalil | 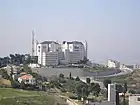 |
North | 1957 | 41,734 | 41,400 | +0.81% | 32.5 | 1,224.4 | 0.055 |
| Ofakim[cbs 28] | 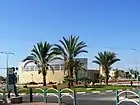 |
South | 1955 | 30,662 | 24,000 | +27.76% | 10.3 | 2,565.0 | −0.757 |
| Or Akiva[cbs 29] | .jpg.webp) |
Haifa | 1951 | 18,972 | 16,000 | +18.58% | 3.5 | 3,165.3 | −0.097 |
| Or Yehuda | 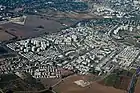 |
Tel Aviv | 1955 | 36,813 | 33,900 | +8.59% | 5.1 | 5,477.7 | 0.133 |
| Petah Tikva[cbs 30] | 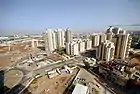 |
Center | 1878 | 247,956 | 200,300 | +23.79% | 35.9 | 6,626.5 | 0.655 |
| Qalansawe | 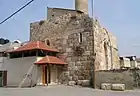 |
Center | Middle Ages | 23,143 | 18,200 | +27.16% | 8.4 | 2,603.2 | −1.011 |
| Ra'anana[cbs 31] | 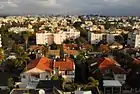 |
Center | 1922 | 75,421 | 68,300 | +10.43% | 14.9 | 4,833.8 | 1.462 |
| Rahat | 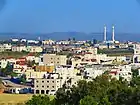 |
South | 1972 | 71,437 | 50,000 | +42.87% | 19.6 | 3,283.9 | −1.848 |
| Ramat Gan | 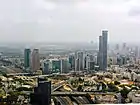 |
Tel Aviv | 1921 | 163,480 | 143,600 | +13.84% | 13.2 | 9,376.1 | 1.041 |
| Ramat HaSharon |  |
Tel Aviv | 1923 | 47,245 | 39,000 | +21.14% | 16.8 | 2,708.3 | 1.796 |
| Ramla | 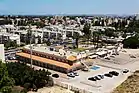 |
Center | 8th century | 76,246 | 65,700 | +16.05% | 11.9 | 6,252.2 | −0.333 |
| Rehovot |  |
Center | 1890 | 143,904 | 111,100 | +29.53% | 23.0 | 5,712.4 | 0.629 |
| Rishon LeZion[cbs 32] | 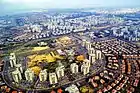 |
Center | 1882 | 254,384 | 226,800 | +12.16% | 58.7 | 4,212.6 | 0.886 |
| Rosh HaAyin | 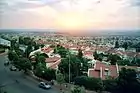 |
Center | 1949 | 61,801 | 37,900 | +63.06% | 24.4 | 2,868.0 | 0.578 |
| Safed[cbs 33] | 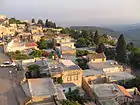 |
North | Bronze Age | 36,094 | 29,600 | +21.94% | 29.2 | 1,123.5 | −1.011 |
| Sakhnin | 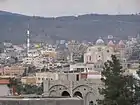 |
North | Bronze Age | 31,702 | 25,100 | +26.30% | 9.8 | 3,062.2 | −0.740 |
| Sderot[cbs 34] |  |
South | 1951 | 27,635 | 20,700 | +33.50% | 4.5 | 3,788.0 | −0.223 |
| Shefa-'Amr[cbs 35] | 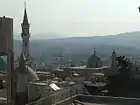 |
North | Bronze Age | 42,137 | 35,700 | +18.03% | 19.8 | 2,065.0 | −0.784 |
| Tamra |  |
North | N/A | 34,392 | 28,100 | +22.39% | 29.3 | 1,118.1 | −0.983 |
| Tayibe | 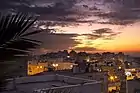 |
Center | N/A | 43,957 | 35,700 | +23.13% | 18.7 | 2,198.7 | −0.878 |
| Tel Aviv-Yafo | .jpg.webp) |
Tel Aviv | Bronze Age (Jaffa) 1887 |
460,613 | 402,600 | +14.41% | 51.8 | 8,473.0 | 1.221 |
| Tiberias | .jpg.webp) |
North | 20 | 44,779 | 41,600 | +7.64% | 10.9 | 2,663.5 | −0.379 |
| Tira[cbs 36] | .jpg.webp) |
Center | N/A | 26,552 | 22,200 | +19.60% | 11.9 | 2,128.7 | −0.469 |
| Tirat Carmel[cbs 37] | 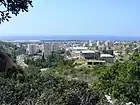 |
Haifa | N/A | 23,112 | 18,600 | +24.26% | 5.6 | 3,425.4 | −0.138 |
| Umm al-Fahm | 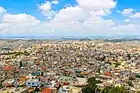 |
Haifa | N/A | 56,109 | 45,000 | +24.69% | 22.3 | 2,053.4 | −1.294 |
| Yavne | 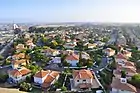 |
Center | Bronze Age | 47,585 | 32,800 | +45.08% | 10.7 | 2,690.9 | 0.455 |
| Yehud-Monosson |  |
Center | N/A | 29,928 | 26,200 | +14.23% | 5.0 | 5,862.3 | 1.034 |
| Yokneam Illit[cbs 38] |  |
North | 1950 | 23,796 | 19,000 | +25.24% | 7.4 | 2,649.1 | 0.800 |
See also
- Arab localities in Israel
- Chronology of Aliyah in modern times
- City council (Israel)
- Demographics of Israel
- Districts of Israel
- Four Holy Cities
- Largest metropolitan areas of the Middle East
- List of cities administered by the Palestinian Authority
- List of cities of the ancient Near East
- List of Israeli twin towns and sister cities
- List of kibbutzim
- List of modern names for biblical place names
- List of moshavim shitufiim
- List of urban areas by Jewish population
- List of villages depopulated during the Arab–Israeli conflict
- Lists of cities by country
- Population displacements in Israel after 1948
- Population statistics for Israeli Gaza Strip settlements
- Population statistics for Israeli settlements in the West Bank
- West Jerusalem
Notes
- General
- Tel Be'er Sheva, remains of the ancient town, lies east of the modern city.
- Official spellings
- Akko
- Arrabe
- Ashqelon
- Be'er Sheva
- Bet She'an
- Bet Shemesh
- Bene Beraq
- Elat
- Giv'at Shemu'el
- Giv'atayim
- Herzliyya
- Kafar Qasem
- Karmi'el
- Kefar Sava
- Kefar Yona
- Qiryat Atta
- Qiryat Bialik
- Qiryat Gat
- Qiryat Mal'akhi
- Qiryat Motzkin
- Qiryat Ono
- Qiryat Shemona
- Qiryat Yam
- Migdal HaEmeq
- Modi'in-Makkabbim-Re'ut
- Nahariyya
- Nes Ziyyona
- Ofaqim
- Or Aqiva
- Petah Tiqwa
- Ra'annana
- Rishon LeZiyyon
- Zefat
- Sederot
- Shefar'am
- Tire
- Tirat Karmel
- Yoqne'am Illit
References
- "Israeli Democracy: How Does It Work?". Israel Ministry of Foreign Affairs. Archived from the original on 22 June 2013. Retrieved 8 May 2013.
- "Inventory of World Cities". Globalization and World Cities Study Group & Network. Archived from the original on 14 October 2013. Retrieved 11 April 2008.
- 2.22 Localities and Population, by Municipal Status and District, 2018
- Symon, Fiona (4 December 2001). "Jerusalem: Crucible of the conflict". BBC News Online. Retrieved 11 October 2012.
- "Background on East Jerusalem". B'Tselem. 8 July 2012. Retrieved 11 October 2012.
- "Population in the Localities 2019" (XLS). Israel Central Bureau of Statistics. Retrieved 16 August 2020.
- "Profiles by Locality". Israel Central Bureau of Statistics. 2008. Archived from the original on 4 March 2016. Retrieved 2 May 2015.
- "2004 local government profile" (in Hebrew). Israel Central Bureau of Statistics. Archived from the original on 7 February 2012. Retrieved 17 August 2007.
- Population and Density per Sq. Km. in Localities Numbering 5,000 Residents and More on 31.12.2016 (Report). Israel Central Bureau of Statistics. 6 September 2017. Retrieved 12 January 2018.
- SOCIO-ECONOMIC INDEX 2013 OF LOCAL AUTHORITIES, IN ALPHABETICAL ORDER OF HEBREW NAMES (PDF) (Report). Israel Central Bureau of Statistics. Archived from the original (PDF) on 13 January 2018. Retrieved 12 January 2018.
External links
- Cities and Communities in Israel at the Israel Ministry of Tourism
- Geography of Israel at the Jewish Virtual Library
- Localities Numbering 5,000 Residents and More at the Israel Central Bureau of Statistics
- Localities of Israel at Curlie
Geography of Israel | |||||||||
|---|---|---|---|---|---|---|---|---|---|
| Districts |
|  | |||||||
| Bodies of water |
| ||||||||
| Cities | |||||||||
| Regions |
| ||||||||
| Islands |
| ||||||||
| Bordering nations | |||||||||
| Archaeology |
| ||||||||