Sea level
Mean sea level (MSL, often shortened to sea level) is an average surface level of one or more among Earth's coastal bodies of water from which heights such as elevation may be measured. The global MSL is a type of vertical datum – a standardised geodetic datum – that is used, for example, as a chart datum in cartography and marine navigation, or, in aviation, as the standard sea level at which atmospheric pressure is measured to calibrate altitude and, consequently, aircraft flight levels. A common and relatively straightforward mean sea-level standard is instead the midpoint between a mean low and mean high tide at a particular location.[1]

Sea levels can be affected by many factors and are known to have varied greatly over geological time scales. Current sea level rise is mainly caused by human-induced climate change.[2] When temperatures rise, mountain glaciers and the polar ice caps melt increasing the amount of water in water bodies. Because most of human settlement and infrastructure was built in response to a more normalized sea level with limited expected change, populations effect by climate change connected sea level rise will need to invest in climate adaptation to mitigate the worst effects or when populations are in extreme risk, a process managed retreat.
The term above sea level generally refers to above mean sea level (AMSL). The term APSL means Above Present Sea Level, comparing sea levels in the past with the level today.
Earth's radius at sea level is 6378.137 km (3963.191 mi) at the equator. It is 6,356.752 km (3,949.903 mi) at the poles and 6,371.001 km (3,958.756 mi) on average.[3]
Measurement
Precise determination of a "mean sea level" is difficult because of the many factors that affect sea level.[4] Instantaneous sea level varies quite a lot on several scales of time and space. This is because the sea is in constant motion, affected by the tides, wind, atmospheric pressure, local gravitational differences, temperature, salinity, and so forth. The easiest way this may be calculated is by selecting a location and calculating the mean sea level at that point and using it as a datum. For example, a period of 19 years of hourly level observations may be averaged and used to determine the mean sea level at some measurement point.
Still-water level or still-water sea level (SWL) is the level of the sea with motions such as wind waves averaged out.[5] Then MSL implies the SWL further averaged over a period of time such that changes due to, e.g., the tides, also have zero mean. Global MSL refers to a spatial average over the entire ocean.
One often measures the values of MSL in respect to the land; hence a change in relative MSL can result from a real change in sea level, or from a change in the height of the land on which the tide gauge operates. In the UK, the Ordnance Datum (the 0 metres height on UK maps) is the mean sea level measured at Newlyn in Cornwall between 1915 and 1921.[6] Before 1921, the vertical datum was MSL at the Victoria Dock, Liverpool. Since the times of the Russian Empire, in Russia and its other former parts, now independent states, the sea level is measured from the zero level of Kronstadt Sea-Gauge. In Hong Kong, "mPD" is a surveying term meaning "metres above Principal Datum" and refers to height of 0.146m above chart datum and 1.304m below the average sea level.[7] In France, the Marégraphe in Marseilles measures continuously the sea level since 1883 and offers the longest collated data about the sea level. It is used for a part of continental Europe and the main part of Africa as the official sea level. Spain uses the reference to measure heights below or above sea level at Alicante, and another European vertical elevation reference (European Vertical Reference System) is to the Amsterdam Peil elevation, which dates back to the 1690s.
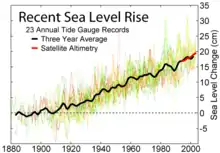
Satellite altimeters have been making precise measurements of sea level[8] since the launch of TOPEX/Poseidon in 1992. A joint mission of NASA and CNES, TOPEX/Poseidon was followed by Jason-1 in 2001 and the Ocean Surface Topography Mission on the Jason-2 satellite in 2008.
Height above mean sea level
Height above mean sea level (AMSL) is the elevation (on the ground) or altitude (in the air) of an object, relative to the average sea level datum. It is also used in aviation, where some heights are recorded and reported with respect to mean sea level (MSL) (contrast with flight level), and in the atmospheric sciences, and land surveying. An alternative is to base height measurements on an ellipsoid of the entire Earth, which is what systems such as GPS do. In aviation, the ellipsoid known as World Geodetic System 84 is increasingly used to define heights; however, differences up to 100 metres (328 feet) exist between this ellipsoid height and mean tidal height. The alternative is to use a geoid-based vertical datum such as NAVD88 and the global EGM96 (part of WGS84).
When referring to geographic features such as mountains on a topographic map, variations in elevation are shown by contour lines. The elevation of a mountain denotes the highest point or summit and is typically illustrated as a small circle on a topographic map with the AMSL height shown in metres, feet or both.
In the rare case that a location is below sea level, the elevation AMSL is negative. For one such case, see Amsterdam Airport Schiphol.
Difficulties in use
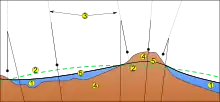
To extend this definition far from the sea means comparing the local height of the mean sea surface with a "level" reference surface, or geodetic datum, called the geoid. In a state of rest or absence of external forces, the mean sea level would coincide with this geoid surface, being an equipotential surface of the Earth's gravitational field which, in itself, does not conform to a simple sphere or ellipsoid and exhibits measurable variations such as those measured by NASA's GRACE satellites to determine mass changes in ice-sheets and aquifers. In reality, this ideal does not occur due to ocean currents, air pressure variations, temperature and salinity variations, etc., not even as a long-term average. The location-dependent, but persistent in time, separation between mean sea level and the geoid is referred to as (mean) ocean surface topography. It varies globally in a range of ± 2 m.
Dry land

Several terms are used to describe the changing relationships between sea level and dry land.
- "relative" means change relative to a fixed point in the sediment pile.[9]
- "eustatic" refers to global changes in sea level relative to a fixed point, such as the centre of the earth, for example as a result of melting ice-caps.[10]
- "steric" refers to global changes in sea level due to thermal expansion and salinity variations.[11]
- "isostatic" refers to changes in the level of the land relative to a fixed point in the earth, possibly due to thermal buoyancy or tectonic effects; it implies no change in the volume of water in the oceans.
The melting of glaciers at the end of ice ages is one example of eustatic sea level rise. The subsidence of land due to the withdrawal of groundwater is an isostatic cause of relative sea level rise.
Paleoclimatologists can track sea level by examining the rocks deposited along coasts that are very tectonically stable, like the east coast of North America. Areas like volcanic islands are experiencing relative sea level rise as a result of isostatic cooling of the rock which causes the land to sink.
On other planets that lack a liquid ocean, planetologists can calculate a "mean altitude" by averaging the heights of all points on the surface. This altitude, sometimes referred to as a "sea level" or zero-level elevation, serves equivalently as a reference for the height of planetary features.
Change
Local and eustatic
Local mean sea level (LMSL) is defined as the height of the sea with respect to a land benchmark, averaged over a period of time (such as a month or a year) long enough that fluctuations caused by waves and tides are smoothed out. One must adjust perceived changes in LMSL to account for vertical movements of the land, which can be of the same order (mm/yr) as sea level changes. Some land movements occur because of isostatic adjustment of the mantle to the melting of ice sheets at the end of the last ice age. The weight of the ice sheet depresses the underlying land, and when the ice melts away the land slowly rebounds. Changes in ground-based ice volume also affect local and regional sea levels by the readjustment of the geoid and true polar wander. Atmospheric pressure, ocean currents and local ocean temperature changes can affect LMSL as well.
Eustatic sea level change (as opposed to local change) results in an alteration to the global sea levels due to changes in either the volume of water in the world's oceans or net changes in the volume of the oceanic basins.[12]
Short-term and periodic changes
.jpg.webp)
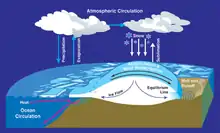
There are many factors which can produce short-term (a few minutes to 14 months) changes in sea level. Two major mechanisms are causing sea level to rise. First, shrinking land ice, such as mountain glaciers and polar ice sheets, is releasing water into the oceans. Second, as ocean temperatures rise, the warmer water expands.[13]
| Periodic sea level changes | ||
|---|---|---|
| Diurnal and semidiurnal astronomical tides | 12–24 h P | 0.2–10+ m |
| Long-period tides | ||
| Rotational variations (Chandler wobble) | 14-month P | |
| Meteorological and oceanographic fluctuations | ||
| Atmospheric pressure | Hours to months | −0.7 to 1.3 m |
| Winds (storm surges) | 1–5 days | Up to 5 m |
| Evaporation and precipitation (may also follow long-term pattern) | Days to weeks | |
| Ocean surface topography (changes in water density and currents) | Days to weeks | Up to 1 m |
| El Niño/southern oscillation | 6 mo every 5–10 yr | Up to 0.6 m |
| Seasonal variations | ||
| Seasonal water balance among oceans (Atlantic, Pacific, Indian) | ||
| Seasonal variations in slope of water surface | ||
| River runoff/floods | 2 months | 1 m |
| Seasonal water density changes (temperature and salinity) | 6 months | 0.2 m |
| Seiches | ||
| Seiches (standing waves) | Minutes to hours | Up to 2 m |
| Earthquakes | ||
| Tsunamis (generate catastrophic long-period waves) | Hours | Up to 10 m |
| Abrupt change in land level | Minutes | Up to 10 m |
Recent changes
Globally, sea levels are rising due to human-caused climate change. Between 1901 and 2018, the globally averaged sea level rose by 15–25 cm (6–10 in), or 1–2 mm per year on average.[14] This rate is accellerating, with sea levels now rising by 3.7 mm per year. Climate scientists expect further acceleration during the 21st century.[15] Climate change heats (and therefore expands) the ocean and melts land-based ice sheets and glaciers.[16] Between 1993 and 2018, the thermal expansion of water contributed 42% to sea level rise; melting of temperate glaciers, 21%; Greenland, 15%; and Antarctica, 8%.[17]: 1576 Over a longer timescale, the sea level is predicted to rise by 2–3 m (7–10 ft) if global warming is limited to 1.5 °C, by up to 6 m (20 ft) if it peaks at 2 °C and by 19–22 metres (62–72 ft) if it peaks at 5 °C.[18]: 21
Sea level rise has a substantial lag in its response to Earth temperature changes. This means that it is virtually certain to continue for a long time,[19] and that its extent in the short term (i.e. around 2050) is insensitive to temperature changes between now and then. Thus, there's confidence that 2050 levels of sea level rise combined with the 2010 population distribution (i.e. absent the effects of population growth and human migration) would result in ~150 million people under the water line during high tide and ~300 million in places which are flooded every year – an increase of 40 and 50 million people relative to 2010 values for the same.[20][21] At the same time, the impact on temperature from changes in greenhouse gas emissions over the longer term would greatly influence longer-term sea level rise: by 2100, the spread between the lowest and the highest plausible emission trajectories would result in the sea level rise of 0.38–0.77 m (1 ft 3 in – 2 ft 6 in) when using the best-understood median estimates.[18]: 21 When compared to 2050 levels, the difference between the low and high end of that range is equivalent to the difference between ~40 million more people under the water line during high tide and ~50 million more in places which are flooded every year (190 and 350 million people) and ~80 and ~90 million more for the same metrics (230 and 390 million people), respectively.[20] Under the highest emission scenario, less-understood processes may also lead to sea level rise of well over one metre (3+1⁄2 ft) by 2100, and the levels of two metres (6+1⁄2 ft) cannot be excluded.[22][18]: TS-45 Applying this extent of sea level rise to the 2010 population distribution could mean as many as 520 million more people under the water line during high tide and 640 million in places which are flooded every year. [20]
While the rise in sea levels ultimately impacts every coastal and island population on Earth[23][24] and leads to higher storm surges, more dangerous tsunamis, damage in cities, loss and degradation of agricultural land and ultimately permanent loss of land and the displacement of populations,[25][26][27] it does not occur uniformly due to local factors like tides, currents, storms, tectonic effects and land subsidence. For instance, sea level rise along US coasts (and along the US East Coast in particular) is already higher than the global average, and it is expected to be 2 to 3 times greater than the global average by the end of the century.[28][22] At the same time, Asia will be the region where sea level rise would impact the most people: eight Asian countries – Bangladesh, China, India, Indonesia, Japan, the Philippines, Thailand and Vietnam – account for 70% of the global population exposed to sea level rise and land subsidence. Altogether, out of the 20 countries with the greatest exposure to sea level rise, 12 are in Asia.[29] Finally, the greatest near-term impact on human populations will occur in the low-lying Caribbean and Pacific islands – many of those would be rendered uninhabitable by sea level rise later this century.[30]
Societies can adapt to sea level rise in three different ways: implement managed retreat, accommodate coastal change, or protect against sea level rise through hard-construction practices like seawalls or soft approaches such as dune rehabilitation and beach nourishment. Sometimes these adaptation strategies go hand in hand, but at other times choices have to be made among different strategies.[31] For instance, a managed retreat strategy is made very difficult if the area is still actively growing: this is a particularly acute problem for Africa, where the population of low-lying coastal areas is projected to increase by around 100 million people within the next 40 years.[32] Poorest nations may also struggle to implement the same approaches to adapt to sea level rise as the richer states, and sea level rise at some locations may be compounded by other environmental issues, such as subsidence at the so-called sinking cities.[33] Natural environments like marine ecosystems typically adapt to rising sea levels and the loss of their constituent species' habitat[34] by moving inland; however, they might not always be able to do so, due to natural or artificial barriers.[35]Aviation
Pilots can estimate height above sea level with an altimeter set to a defined barometric pressure. Generally, the pressure used to set the altimeter is the barometric pressure that would exist at MSL in the region being flown over. This pressure is referred to as either QNH or "altimeter" and is transmitted to the pilot by radio from air traffic control (ATC) or an automatic terminal information service (ATIS). Since the terrain elevation is also referenced to MSL, the pilot can estimate height above ground by subtracting the terrain altitude from the altimeter reading. Aviation charts are divided into boxes and the maximum terrain altitude from MSL in each box is clearly indicated. Once above the transition altitude, the altimeter is set to the international standard atmosphere (ISA) pressure at MSL which is 1013.25 hPa or 29.92 inHg.[36]
See also
- Above ground level
- Before Present – Time scale used mainly in archaeology, geology and other scientific disciplines
- Chart datum – Level of water from which depths displayed on a nautical chart are measured
- Extreme points of Earth
- Geopotential height
- Height above average terrain – Height based on large area surrounding object; often used in U.S. for antenna towers
- List of places on land with elevations below sea level
- Raised beach, also known as Marine terrace – Emergent coastal landform
- Meltwater pulse 1A – Period of rapid post-glacial sea level rise
- Metres above the Adriatic
- Amsterdam Ordnance Datum, also known as Normaal Amsterdams Peil – Vertical datum
- Normal height
- Normalhöhennull – Vertical datum used in Germany
- Normalnull – Outdated official vertical datum used in Germany
- North West Shelf Operational Oceanographic System – Facility that monitors physical, sedimentological and ecological variables for the North Sea area
- Ordnance datum – Vertical datum used as the basis for deriving altitudes on maps (UK and Ireland)
- Orthometric height – Altitude above geoid or mean sea level
- Sea level equation
- Vertical datum – Reference surface for vertical positions
- World Geodetic System – Geodetic reference system
References
- What is "Mean Sea Level"? (Proudman Oceanographic Laboratory).
- USGCRP (2017). "Climate Science Special Report. Chapter 12: Sea Level Rise. Key finding 1". science2017.globalchange.gov: 1–470. Retrieved 27 December 2018.
- "Earth Radius by Latitude Calculator".
- US National Research Council, Bulletin of the National Research Council 1932 page 270
- "Still-water level - AMS Glossary". glossary.ametsoc.org.
- "Ordnance Survey Benchmark locator". Retrieved 21 December 2021.
- Notes , HKO, 10/5/2021.
- Glazman, Roman E; Greysukh, Alexander; Zlotnicki, Victor (1994). "Evaluating models of sea state bias in satellite altimetry". Journal of Geophysical Research. 99 (C6): 12581. Bibcode:1994JGR....9912581G. doi:10.1029/94JC00478.Roman Glazman Greysukh, A. M., Zlotnicki, V.
- Jackson, Julia A., ed. (1987). "Relative rise in sea level". Glossary of geology (Fourth ed.). Alexandria, Virginia. ISBN 0922152349.
- Jackson, Julia A., ed. (1987). "Eustatic". Glossary of geology (Fourth ed.). Alexandria, Virginia. ISBN 0922152349.
- Jackson, Julia A., ed. (1987). "Steric". Glossary of geology (Fourth ed.). Alexandria, Virginia. ISBN 0922152349.
- "Eustatic sea level". Oilfield Glossary. Schlumberger Limited. Retrieved 10 June 2011.
- "Global Warming Effects on Sea Level". www.climatehotmap.org. Retrieved 2 December 2016.
- IPCC, 2019: Summary for Policymakers. In: IPCC Special Report on the Ocean and Cryosphere in a Changing Climate [H.-O. Pörtner, D.C. Roberts, V. Masson-Delmotte, P. Zhai, M. Tignor, E. Poloczanska, K. Mintenbeck, A. Alegría, M. Nicolai, A. Okem, J. Petzold, B. Rama, N.M. Weyer (eds.)]. Cambridge University Press, Cambridge, UK and New York, NY, USA. https://doi.org/10.1017/9781009157964.001.
- Fox-Kemper, B., H.T. Hewitt, C. Xiao, G. Aðalgeirsdóttir, S.S. Drijfhout, T.L. Edwards, N.R. Golledge, M. Hemer, R.E. Kopp, G. Krinner, A. Mix, D. Notz, S. Nowicki, I.S. Nurhati, L. Ruiz, J.-B. Sallée, A.B.A. Slangen, and Y. Yu, 2021: Chapter 9: Ocean, Cryosphere and Sea Level Change. In Climate Change 2021: The Physical Science Basis. Contribution of Working Group I to the Sixth Assessment Report of the Intergovernmental Panel on Climate Change [Masson-Delmotte, V., P. Zhai, A. Pirani, S.L. Connors, C. Péan, S. Berger, N. Caud, Y. Chen, L. Goldfarb, M.I. Gomis, M. Huang, K. Leitzell, E. Lonnoy, J.B.R. Matthews, T.K. Maycock, T. Waterfield, O. Yelekçi, R. Yu, and B. Zhou (eds.)]. Cambridge University Press, Cambridge, United Kingdom and New York, NY, USA, pp. 1211–1362, doi:10.1017/9781009157896.011.
- Mengel, Matthias; Levermann, Anders; Frieler, Katja; Robinson, Alexander; Marzeion, Ben; Winkelmann, Ricarda (8 March 2016). "Future sea level rise constrained by observations and long-term commitment". Proceedings of the National Academy of Sciences. 113 (10): 2597–2602. Bibcode:2016PNAS..113.2597M. doi:10.1073/pnas.1500515113. PMC 4791025. PMID 26903648.
- WCRP Global Sea Level Budget Group (2018). "Global sea-level budget 1993–present". Earth System Science Data. 10 (3): 1551–1590. Bibcode:2018ESSD...10.1551W. doi:10.5194/essd-10-1551-2018.
This corresponds to a mean sea-level rise of about 7.5 cm over the whole altimetry period. More importantly, the GMSL curve shows a net acceleration, estimated to be at 0.08mm/yr2.
- IPCC, 2021: Summary for Policymakers. In: Climate Change 2021: The Physical Science Basis. Contribution of Working Group I to the Sixth Assessment Report of the Intergovernmental Panel on Climate Change [Masson-Delmotte, V., P. Zhai, A. Pirani, S.L. Connors, C. Péan, S. Berger, N. Caud, Y. Chen, L. Goldfarb, M.I. Gomis, M. Huang, K. Leitzell, E. Lonnoy, J.B.R. Matthews, T.K. Maycock, T. Waterfield, O. Yelekçi, R. Yu, and B. Zhou (eds.)]. Cambridge University Press, Cambridge, United Kingdom and New York, NY, USA, pp. 3−32, doi:10.1017/9781009157896.001.
- National Academies of Sciences, Engineering, and Medicine (2011). "Synopsis". Climate Stabilization Targets: Emissions, Concentrations, and Impacts over Decades to Millennia. Washington, DC: The National Academies Press. p. 5. doi:10.17226/12877. ISBN 978-0-309-15176-4.
Box SYN-1: Sustained warming could lead to severe impacts
- Kulp, Scott A.; Strauss, Benjamin H. (29 October 2019). "New elevation data triple estimates of global vulnerability to sea-level rise and coastal flooding". Nature Communications. 10 (1): 4844. Bibcode:2019NatCo..10.4844K. doi:10.1038/s41467-019-12808-z. PMC 6820795. PMID 31664024.
- Rosane, Olivia (30 October 2019). "300 Million People Worldwide Could Suffer Yearly Flooding by 2050". Ecowatch. Retrieved 31 October 2019.
- "2022 Sea Level Rise Technical Report". oceanservice.noaa.gov. Retrieved 4 July 2022.
- McMichael, Celia; Dasgupta, Shouro; Ayeb-Karlsson, Sonja; Kelman, Ilan (27 November 2020). "A review of estimating population exposure to sea-level rise and the relevance for migration". Environmental Research Letters. 15 (12): 123005. Bibcode:2020ERL....15l3005M. doi:10.1088/1748-9326/abb398. ISSN 1748-9326. PMC 8208600. PMID 34149864.
- Bindoff, N.L.; Willebrand, J.; Artale, V.; Cazenave, A.; Gregory, J.; Gulev, S.; Hanawa, K.; Le Quéré, C.; Levitus, S.; Nojiri, Y.; Shum, C.K.; Talley L.D.; Unnikrishnan, A. (2007), "Section 5.5.1: Introductory Remarks", in IPCC AR4 WG1 (ed.), Chapter 5: Observations: Ocean Climate Change and Sea Level, ISBN 978-0-521-88009-1, archived from the original on 20 June 2017, retrieved 25 January 2017
- TAR Climate Change 2001: The Scientific Basis (PDF) (Report). International Panel on Climate Change, Cambridge University Press. 2001. ISBN 0521-80767-0. Retrieved 23 July 2021.
- "Sea level to increase risk of deadly tsunamis". UPI. 2018.
- Holder, Josh; Kommenda, Niko; Watts, Jonathan (3 November 2017). "The three-degree world: cities that will be drowned by global warming". The Guardian. Retrieved 28 December 2018.
- Choi, Charles Q. (27 June 2012). "Sea Levels Rising Fast on U.S. East Coast". National Oceanic and Atmospheric Administration. Retrieved 22 October 2022.
- Shaw, R., Y. Luo, T.S. Cheong, S. Abdul Halim, S. Chaturvedi, M. Hashizume, G.E. Insarov, Y. Ishikawa, M. Jafari, A. Kitoh, J. Pulhin, C. Singh, K. Vasant, and Z. Zhang, 2022: Chapter 10: Asia. In Climate Change 2022: Impacts, Adaptation and Vulnerability [H.-O. Pörtner, D.C. Roberts, M. Tignor, E.S. Poloczanska, K. Mintenbeck, A. Alegría, M. Craig, S. Langsdorf, S. Löschke,V. Möller, A. Okem, B. Rama (eds.)]. Cambridge University Press, Cambridge, United Kingdom and New York, NY, USA, pp. 1457–1579 |doi=10.1017/9781009325844.012
- Mycoo, M., M. Wairiu, D. Campbell, V. Duvat, Y. Golbuu, S. Maharaj, J. Nalau, P. Nunn, J. Pinnegar, and O. Warrick, 2022: Chapter 15: Small islands. In Climate Change 2022: Impacts, Adaptation and Vulnerability [H.-O. Pörtner, D.C. Roberts, M. Tignor, E.S. Poloczanska, K. Mintenbeck, A. Alegría, M. Craig, S. Langsdorf, S. Löschke,V. Möller, A. Okem, B. Rama (eds.)]. Cambridge University Press, Cambridge, United Kingdom and New York, NY, USA, pp. 2043–2121 |doi=10.1017/9781009325844.017
- Thomsen, Dana C.; Smith, Timothy F.; Keys, Noni (2012). "Adaptation or Manipulation? Unpacking Climate Change Response Strategies". Ecology and Society. 17 (3). doi:10.5751/es-04953-170320. JSTOR 26269087.
- Trisos, C.H., I.O. Adelekan, E. Totin, A. Ayanlade, J. Efitre, A. Gemeda, K. Kalaba, C. Lennard, C. Masao, Y. Mgaya, G. Ngaruiya, D. Olago, N.P. Simpson, and S. Zakieldeen 2022: Chapter 9: Africa. In Climate Change 2022: Impacts, Adaptation and Vulnerability [H.-O. Pörtner, D.C. Roberts, M. Tignor, E.S. Poloczanska, K. Mintenbeck, A. Alegría, M. Craig, S. Langsdorf, S. Löschke,V. Möller, A. Okem, B. Rama (eds.)]. Cambridge University Press, Cambridge, United Kingdom and New York, NY, USA, pp. 2043–2121 |doi=10.1017/9781009325844.011
- Nicholls, Robert J.; Marinova, Natasha; Lowe, Jason A.; Brown, Sally; Vellinga, Pier; Gusmão, Diogo de; Hinkel, Jochen; Tol, Richard S. J. (2011). "Sea-level rise and its possible impacts given a 'beyond 4°C (39.2°F)world' in the twenty-first century". Philosophical Transactions of the Royal Society of London A: Mathematical, Physical and Engineering Sciences. 369 (1934): 161–181. Bibcode:2011RSPTA.369..161N. doi:10.1098/rsta.2010.0291. ISSN 1364-503X. PMID 21115518. S2CID 8238425.
- "Sea Level Rise". National Geographic. 13 January 2017.
- "Sea level rise poses a major threat to coastal ecosystems and the biota they support". birdlife.org. Birdlife International. 2015.
- US Federal Aviation Administration, Code of Federal Regulations Sec. 91.121
External links
- Sea Level Rise:Understanding the past – Improving projections for the future
- Permanent Service for Mean Sea Level
- Global sea level change: Determination and interpretation
- Environment Protection Agency Sea level rise reports
- Properties of isostasy and eustasy
- Measuring Sea Level from Space
- Rising Tide Video: Scripps Institution of Oceanography
- Sea Levels Online: National Ocean Service (CO-OPS)
- Système d'Observation du Niveau des Eaux Littorales (SONEL)
- Sea level rise – How much and how fast will sea level rise over the coming centuries?
Physical oceanography | ||
|---|---|---|
| Waves |
|   |
| Circulation |
| |
| Tides |
| |
| Landforms |
| |
| Plate tectonics |
| |
| Ocean zones | ||
| Sea level |
| |
| Acoustics |
| |
| Satellites |
| |
| Related |
| |
| ||