Demografía de Singapur
La demografía de Singapur incluye las estadísticas de población de Singapur, como la densidad de población, el origen étnico, el nivel de educación, la salud de la población, el estado económico, las afiliaciones religiosas y otros datos demográficos de la población.
En junio de 2021, la población de Singapur era de 5,45 millones[1] .De su población total de 5,45 millones en 2021, 4 millones son residentes, que consisten en ciudadanos y residentes permanentes (RP), y 1,45 millones son no residentes, que consiste en personas con varios pases de trabajo y estudiantes extranjeros
Tendencia demográfica
Fuente: Singapore Department of Statistics[2]
| Year | Number ('000) | Growth (year on year) | Land area (km2)[3] | Population density (persons per km2) | ||||||||
|---|---|---|---|---|---|---|---|---|---|---|---|---|
| Población total | Residentes totales | Ciudadanos | Residentes permanentes | Non-residents | Total population | Total residents | Singapore citizens | Permanent residents | Non-residents | |||
| 1950 | 1,022.1 | na | na | na | na | 4.4% | na | na | na | na | na | na |
| 1955 | 1,305.5 | na | na | na | na | 4.6% | na | na | na | na | na | na |
| 1960 | 1,646.4 | na | na | na | na | 3.7% | na | na | na | na | 581.5 | 2,831 |
| 1965 | 1,886.9 | na | na | na | na | 2.5% | na | na | na | na | 581.5 | 3,245 |
| 1970 | 2,074.5 | 2,013.6 | 1,874.8 | 138.8 | 60.9 | 2.8% | na | na | na | na | 586.4 | 3,538 |
| 1975 | 2,262.6 | na | na | na | na | 1.5% | na | na | na | na | 596.8 | 3,791 |
| 1980 | 2,413.9 | 2,282.1 | 2,194.3 | 87.8 | 131.8 | 1.5% | 1.3% | na | na | na | 617.8 | 3,907 |
| 1985 | 2,736 | 2,482.6 | na | na | 253.3 | 0.1% | 1.6% | na | na | na | 620.5 | 4,409 |
| 1990 | 3,047.1 | 2,735.9 | 2,623.7 | 112.1 | 311.3 | 2.3% | 1.7% | 1.7% | 2.3% | 9.0% | 633 | 4,706 |
| 1995 | 3,524.5 | 3,013.5 | 2,823.7 | 189.8 | 511 | 3.1% | 1.8% | 1.4% | 8.3% | 11.2% | 647.5 | 5,443 |
| 2000 | 4,027.9 | 3,273.4 | 2,985.9 | 287.5 | 754.5 | 2.8% | 1.8% | 1.3% | 9.9% | 9.3% | 682.7 | 5,900 |
| 2005 | 4,265.8 | 3,467.8 | 3,081 | 386.8 | 797.9 | 2.4% | 1.6% | 0.8% | 8.6% | 5.9% | 697.9 | 6,121 |
| 2010 | 5,076.7 | 3,771.7 | 3,230.7 | 541.0 | 1,305.0 | 1.8% | 1.0% | 0.9% | 1.5% | 4.1% | 712.4 | 7,126 |
| 2015 | 5,535.0 | 3,902.7 | 3,375.0 | 527.7 | 1,632.3 | 1.2% | 0.8% | 1.0% | 0% | 2.1% | 719.1 | 7,697 |
| 2020 | 5,685,8 | 4,044.2 | 3,523.2 | 521 | 1,641.6 | -0.3% | 0.4% | 0.6% | -0.8% | 0.02% | 728.3 | 7,810 |
This animation shows the share of age groups for the population of Singapore from 1960 – 2016. The age group which contains the median is highlighted. The population of Singapore is considered to be ageing rapidly.[4]
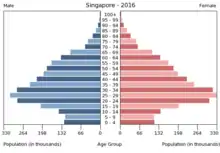
Population pyramid according to the CIA
Composición por género de la población residente
Fuente: Singapore Department of Statistics[4]
| Year | 1960 | 1965 | 1970 | 1975 | 1980 | 1985 | 1990 | 1995 | 2000 | 2005 | 2010 | 2015 | 2020 |
|---|---|---|---|---|---|---|---|---|---|---|---|---|---|
| Total | 1,646.4 | 1,886.9 | 2,013.6 | 2,262.6 | 2,282.1 | 2,482.6 | 2,735.9 | 3,013.5 | 3,273.4 | 3,467.8 | 3,771.7 | 3,902.7 | 4,044.2 |
| Males | 859.6 | 973.8 | 1,030.8 | 1,6.1 | 1,9.0 | 1,258.5 | 1,386.3 | 1,514.0 | 1,634.7 | 1,721.1 | 1,861.1 | 1,916.6 | 1,977.6 |
| Females | 786.8 | 913.1 | 982.8 | 1,106.5 | 1,123.1 | 1,224.2 | 1,349.6 | 1,499.5 | 1,638.7 | 1,746.7 | 1,910.6 | 1,986.1 | 2,066.7 |
| Sex ratio (males per 1,000 females) | 1,093 | 1,066 | 1,049 | 1,045 | 1,032 | 1,028 | 1,027 | 1,010 | 998 | 985 | 974 | 965 | 957 |
Age distribution of resident population
Source: Singapore Department of Statistics[5]
| Age group (years) | 1990 | 2000 | 2010 | 2011 | 2012 | 2013 | 2014 |
|---|---|---|---|---|---|---|---|
| Below 15 | 23.0% | 21.9% | 17.4% | 16.8% | 16.4% | 16.0% | 15.7% |
| 15–24 | 16.9% | 12.9% | 13.5% | 13.6% | 13.7% | 13.6% | 13.2% |
| 25–34 | 21.5% | 17.0% | 15.1% | 14.8% | 14.4% | 14.4% | 14.4% |
| 35–44 | 16.9% | 19.4% | 16.7% | 16.4% | 16.3% | 16.1% | 16.0% |
| 45–54 | 9.0% | 14.3% | 16.6% | 16.7% | 16.5% | 16.4% | 16.1% |
| 55–64 | 6.7% | 7.2% | 11.7% | 12.4% | 12.7% | 13.1% | 13.4% |
| 65 and over | 6.0% | 7.2% | 9.0% | 9.3% | 9.9% | 10.5% | 11.2% |
| Edad media (años) | 29.8 | 34.0 | 37.4 | 38.0 | 38.4 | 38.9[6] | 39.3[6] |
Referencias
- «Statistics Singapore – Population». Department of Statistics Singapore. Consultado el 25 de junio de 2021.
- «M810001 – Indicators on Population, Annual». Singapore Department of Statistics. Archivado desde el original el 4 de noviembre de 2020. Consultado el 12 de febrero de 2022.
- «M890151 – Land Area (As at December), Annual». Statistics Singapore.
- «Singapore Residents By Age Group, Ethnic Group And Gender, End June, Annual». Singapore Department of Statistics. Consultado el 30 de abril de 2021.
- Population Trends 2012 Archivado el 13 de noviembre de 2012 en Wayback Machine. Department of Statistics, Singapore.
- topic3 Archivado el 11 de septiembre de 2015 en Wayback Machine. (Population). Retrieved from Singapore – Yearbook of Statistics Singapore, 2015, Department of Statistics, Singapore. Retrieved on 28 August 2015.
| Control de autoridades |
|
|---|
 Datos: Q2359833
 Multimedia: Demographics of Singapore / Q2359833
Este artículo ha sido escrito por Wikipedia. El texto está disponible bajo la licencia Creative Commons - Atribución - CompartirIgual. Pueden aplicarse cláusulas adicionales a los archivos multimedia.