Photoshop Basics
Reading a Histogram

Reading a histogram
If you've ever used a Levels or Curves adjustment layer, you may have noticed a graph in the area where you're making the adjustment. This graph is known as a histogram. The histogram basically shows you how many shadows, midtones, and highlights there are in the image.
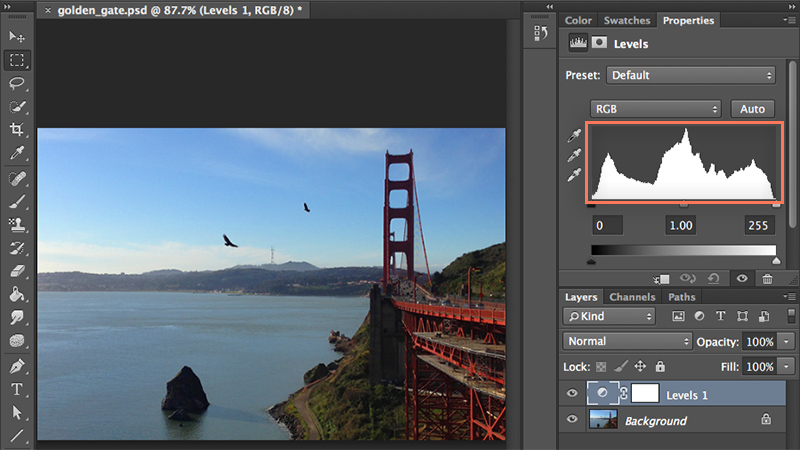
In the example below, we have the Levels adjustment layer selected, and you can see the histogram in the Properties panel on the right.

So what does the histogram tell us about this image? First, remember that every image has a mix of shadows, midtones, and highlights. The histogram simply counts the number of pixels for each tone and displays them as a graph with shadows on the left, midtones in the middle, and highlights on the right. Note that the histogram only tells you how much there is of each tone; it doesn't tell you where the tones are located in the image.
In the example above, we have a mix of different tones. The rocks and ground near the bottom of the image make up most of the shadows, the bridge and ocean make up the midtones, and the sky and clouds make up the highlights. If you look at the histogram, you can see that the image has a fairly even balance among the three.
The histogram will be unique for every image, and it won't always be so evenly distributed. For example, take a look at the image below. You can see that most of the information in the histogram is stacked on the left. This means a majority of the pixels for this image are shadows: the dark areas in the background, the shadows on the leaves, and the dark patterns on the butterfly's wings.

Below, we have a photo of a white flower on a light background. As you might expect, there are more highlights than shadows in this image, so most of the information in the histogram is stacked on the right.

The image below has large peaks of information on the left and right sides of the histogram but flat areas in the middle. This means the image has a lot of shadows and highlights—in the water and the stones—but very few midtones. You could also say this image has a lot of contrast.

Recognizing common problems
Knowing how to read a histogram can tell you several different things about a photo. For example, you can use the histogram to find common problems in your images. You can then use different tools like Levels and Curves to correct and improve them.

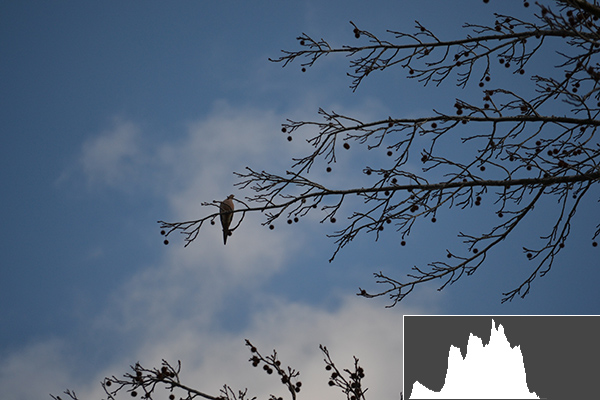
In the example above, you can see that there's a large gap on the right side of the histogram, which means the image is underexposed, or too dark. You can correct these types of problems with a Levels adjustment.
However, if you're not careful when making these adjustments you'll begin to lose detail in your image. This is known as clipping. In the image below, you can see that the clouds have lost a lot of detail, and the color of the sky has also changed. Also notice the sharp peak on the right-most side of the histogram. Whenever you see this in a histogram, it means clipping has occurred.

The histogram is an important tool for finding problems in your images, so you should always keep an eye on it whenever you're making adjustments. You can review our lesson on levels, curves, and color to learn more about making adjustments.
The Histogram panel
There are a few ways to view the histogram for an image. As we mentioned above, you'll see the histogram in the Properties panel whenever you edit a Levels or Curves adjustment layer.
However, this histogram will not be updated when making a change within an adjustment layer. If you're using adjustment layers in your document, we recommend referring to the Histogram panel to look for problems because it will take the adjustment layers into account. You can go to Window, then select Histogram to open the Histogram panel at any time.

This panel will display a gray histogram that works exactly like the histograms shown above. It also includes a few colored histograms that allow you to see how the individual colors in the image are distributed.

More resources
As you gain more experience with histograms, you'll be able to read them more easily and make adjustments with confidence. To learn even more about working with histograms, review these tutorials.
- View Histograms and Pixel Values (Adobe)
- How to Read an Image Histogram in Photoshop (Photoshop Essentials)
- Camera Histograms: Tones & Contrast (Cambridge in Colour)