The Purpose of Organization Charts
An organization chart (sometimes called an organizational chart, an org chart, or an organogram) is a diagram that illustrates the structure of an organization, the relationships and relative ranks of its business units/divisions, and the positions or roles assigned to each unit/division.
Examples of such roles include managers of various departments, subordinates within these departments, directors, and chief executive officers. When an organization chart grows too large, it can be split into smaller charts that show only individual departments within the organization.
Prior to applying for a job or beginning work with an organization, a prospective employee should procure a copy of the organization chart. New employees or managers can then know with whom to consult about particular issues, as well as understand the distribution of authority within the company. The org chart can also provide insight into the broader strategy of the company—such as the degree of innovation versus process control being pursued, the flexibility of project management, the degree of autonomy, and the broader company culture.
The different types of organization charts include hierarchical, matrix, and flat (also known as horizontal). These are described briefly below.
Hierarchical Organization Charts
A hierarchical organization is an organizational structure with several reporting layers. Every entity within the organization—except for the owners—is subordinate and reports to a higher level entity.
Matrix Organization Charts
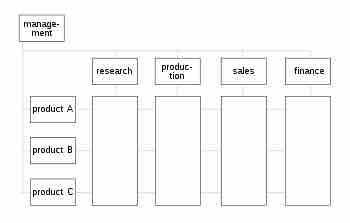
A matrix organizational chart displays how people with similar skills are pooled together for work assignments.

Matrix organizational chart
In a matrix structure, the organization is grouped by both product and function. Product lines are managed horizontally and functions are managed vertically. This means that each function—e.g., research, production, sales, and finance—has separate internal divisions for each product.
Flat or Horizontal Organization Charts
A flat organization chart shows few or no levels of intervening management between staff and managers. A flat chart will simply look like a line of boxes with no overt authority implied.