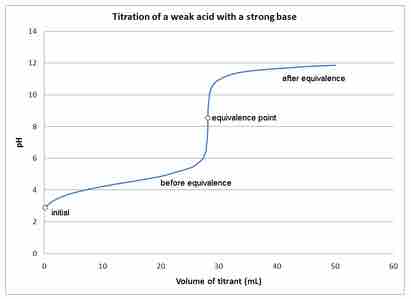
Titrations are reactions between specifically selected reactants—in this case, a strong base and a weak acid. A titration curve reflects the strength of the corresponding acid and base, showing the pH change during titration. The titration curve demonstrating the pH change during the titration of the strong base with a weak acid shows that at the beginning, the pH changes very slowly and gradually. This indicates the formation of a buffer system as the titration approaches the equivalence point.
At the equivalence point and beyond, the curve is typical of a titration of, for example, NaOH and HCl. When the NaOH is in excess, the pH change is the same as in any system dominated by NaOH.

Titration of a weak Acid with a strong base
This figure depicts the pH changes during a titration of a weak acid with a strong base.
The initial pH of the solution at the beginning of the titration is approximately that of the weak acid in water. At the equivalence point, all of the weak acid is neutralized and converted to its conjugate base (the number of moles of H+ = added number of moles of OH-). However, the pH at the equivalence point does not equal 7. This is due to the production of conjugate base during the titration. The resulting solution is slightly basic. The endpoint and the equivalence point are not exactly the same: the equivalence point is determined by the stoichiometry of the reaction, while the endpoint is just the color change from the indicator.
Example:
The titration of acetic acid (HC2H3O2) with NaOH.
During this titration, as the OH- reacts with the H+ from acetic acid, the acetate ion (C2H3O2-) is formed. This conjugate base reacts with water to form a slightly basic solution.