Concept
Version 10
Created by Boundless
Freezing Point Depression

Effect of solutes on physical properties
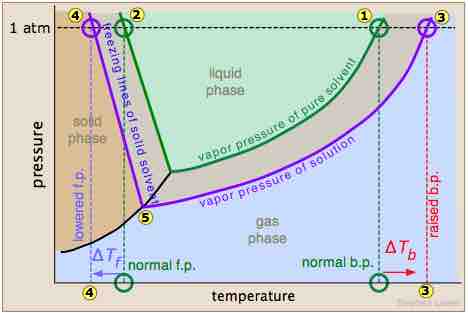
A triple phase diagram which shows the pressure and temperature of the normal boiling and freezing points of a solvent (green lines) and the boiling and freezing points of a solution (purple lines). Notice that at 1 atm of pressure, the freezing point has been lowered (represented by numbers 2 and 4).
Source
Boundless vets and curates high-quality, openly licensed content from around the Internet. This particular resource used the following sources:
"Colligative properties of solutions."
http://www.chem1.com/acad/webtext/solut/solut-3.html#SEC3
Steve Lower
CC BY-SA.