Concept
Version 7
Created by Boundless
The Phillips Curve

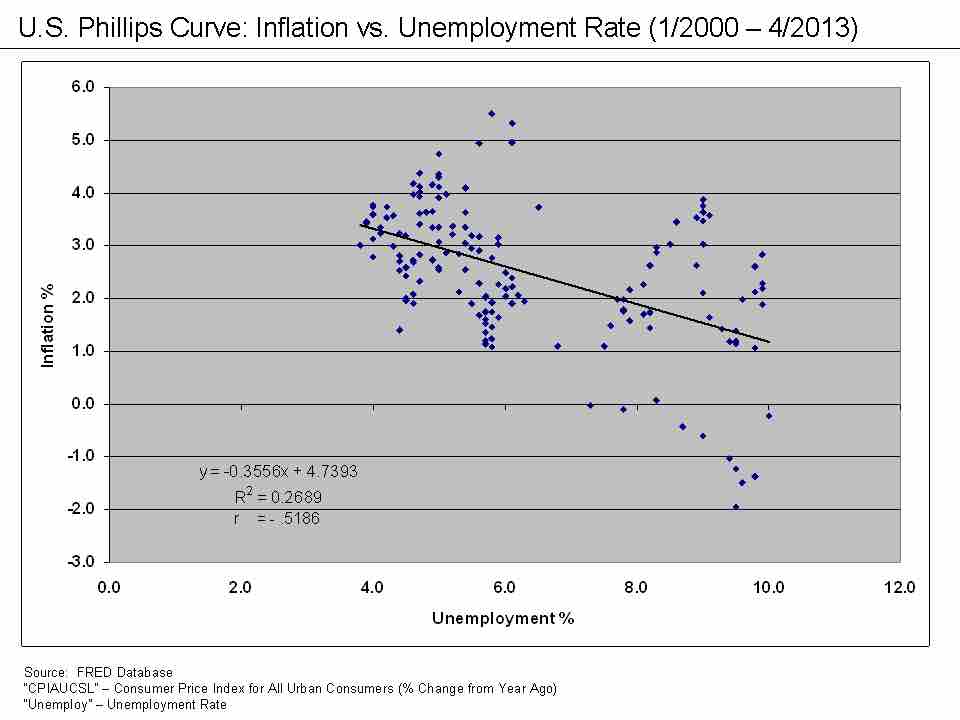
US Phillips Curve (2000 - 2013)
The data points in this graph span every month from January 2000 until April 2013. They do not form the classic L-shape the short-run Phillips curve would predict. Although it was shown to be stable from the 1860's until the 1960's, the Phillips curve relationship became unstable - and unusable for policy-making - in the 1970's.
Source
Boundless vets and curates high-quality, openly licensed content from around the Internet. This particular resource used the following sources:
"U.S.
Phillips Curve 2000 to 2013."
http://en.wikipedia.org/wiki/File:U.S._Phillips_Curve_2000_to_2013.png
Wikipedia
CC BY-SA.