Concept
Version 8
Created by Boundless
Quantitative and Analytical Management Tools

Trend chart
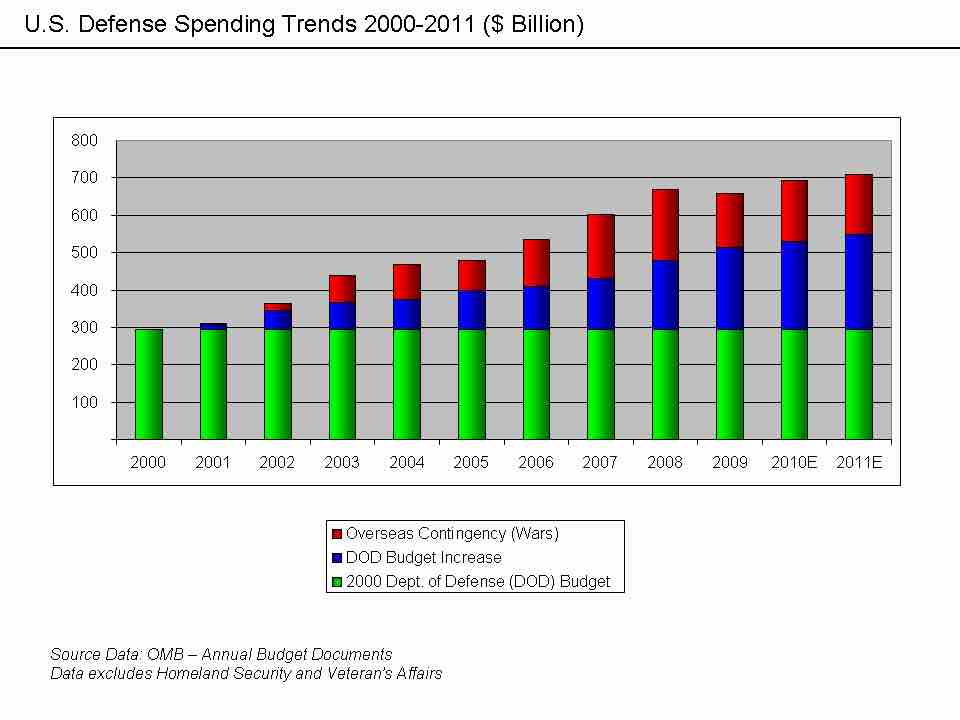
A trend chart shows changes in spending, prices, efficiency, or any other metric that management is interested in analyzing over time. This chart of U.S. defense spending from 2000–2011 shows that overall spending increased from $300 billion to $700 billion due to increases in both the Department of Defense (DOD) budget and overseas (war-related) spending.
Source
Boundless vets and curates high-quality, openly licensed content from around the Internet. This particular resource used the following sources: