What is a Cumulative Frequency Distribution?
A cumulative frequency distribution is the sum of the class and all classes below it in a frequency distribution. Rather than displaying the frequencies from each class, a cumulative frequency distribution displays a running total of all the preceding frequencies.
How to Construct a Cumulative Frequency Distribution
Constructing a cumulative frequency distribution is not that much different than constructing a regular frequency distribution. The beginning process is the same, and the same guidelines must be used when creating classes for the data. Recall the following:
- Each data value should fit into one class only (classes are mutually exclusive).
- The classes should be of equal size.
- Classes should not be open-ended.
- Try to use between 5 and 20 classes.
Create the frequency distribution table, as you would normally. However, this time, you will need to add a third column. The first column should be labeled Class or Category. The second column should be labeled Frequency. The third column should be labeled Cumulative Frequency. Fill in your class limits in column one. Then, count the number of data points that falls in each class and write that number in column two.
Next, start to fill in the third column. The first entry will be the same as the first entry in the Frequency column. The second entry will be the sum of the first two entries in the Frequency column, the third entry will be the sum of the first three entries in the Frequency column, etc. The last entry in the Cumulative Frequency column should equal the number of total data points, if the math has been done correctly.
Graphical Displays of Cumulative Frequency Distributions
There are a number of ways in which cumulative frequency distributions can be displayed graphically. Histograms are common , as are frequency polygons . Frequency polygons are a graphical device for understanding the shapes of distributions. They serve the same purpose as histograms, but are especially helpful in comparing sets of data.

Frequency Polygon
This graph shows an example of a cumulative frequency polygon.

Frequency Histograms
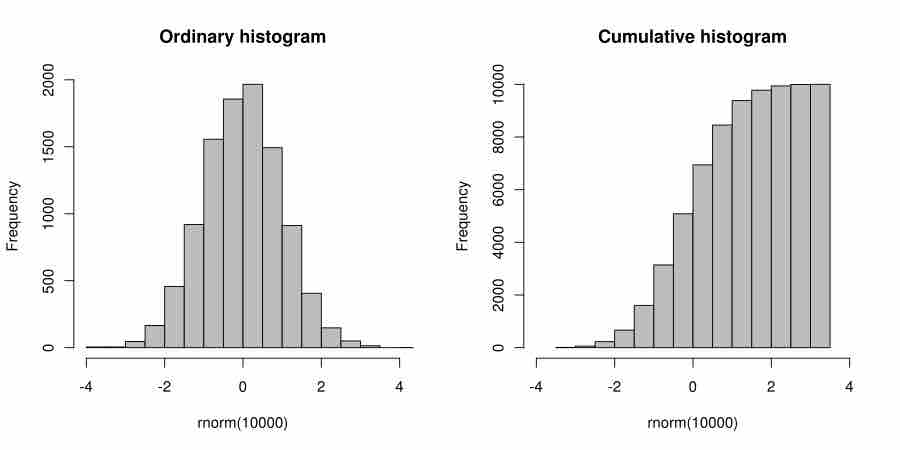
This image shows the difference between an ordinary histogram and a cumulative frequency histogram.