For many advanced calculations and/or graphical representations, statistical calculators are often quite helpful for statisticians and students of statistics. Two of the most common calculators in use are the TI-83 series and the R statistical software environment.
TI-83
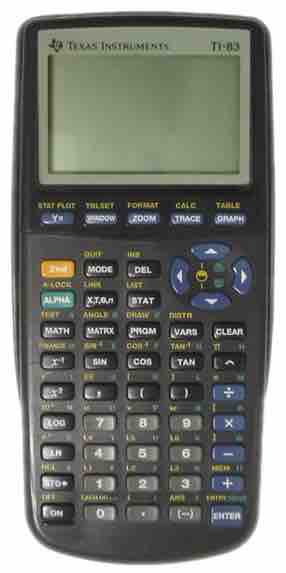
The TI-83 series of graphing calculators, shown in , is manufactured by Texas Instruments. Released in 1996, it was one of the most popular graphing calculators for students. In addition to the functions present on normal scientific calculators, the TI-83 includes many andvanced features, including function graphing, polar/parametric/sequence graphing modes, statistics, trigonometric, and algebraic functions, along with many useful applications.

TI-83
The TI-83 series of graphing calculators is one of the most popular calculators for statistics students.
The TI-83 has a handy statistics mode (accessed via the "STAT" button) that will perform such functions as manipulation of one-variable statistics, drawing of histograms and box plots, linear regression, and even distribution tests.
R
R (logo shown in ) is a free software programming language and a software environment for statistical computing and graphics. The R language is widely used among statisticians and data miners for developing statistical software and data analysis. Polls and surveys of data miners are showing R's popularity has increased substantially in recent years.
R is an implementation of the S programming language, which was created by John Chambers while he was at Bell Labs. R was created by Ross Ihaka and Robert Gentleman at the University of Auckland, New Zealand, and is currently developed by the R Development Core Team, of which Chambers is a member. R is a GNU project, which means it's source code is freely available under the GNU General Public License.
R provides a wide variety of statistical and graphical techniques, including linear and nonlinear modeling, classical statistical tests, time-series analysis, classification, and clustering. Another strength of R is static graphics, which can produce publication-quality graphs, including mathematical symbols. Dynamic and interactive graphics are available through additional packages.
R is easily extensible through functions and extensions, and the R community is noted for its active contributions in terms of packages. These packagers allow specialized statistical techniques, graphical devices, import/export capabilities, reporting tools, et cetera. Due to its S heritage, R has stronger object-oriented programming facilities than most statistical computing languages.