Concept
Version 20
Created by Boundless
African Americans and the Republic

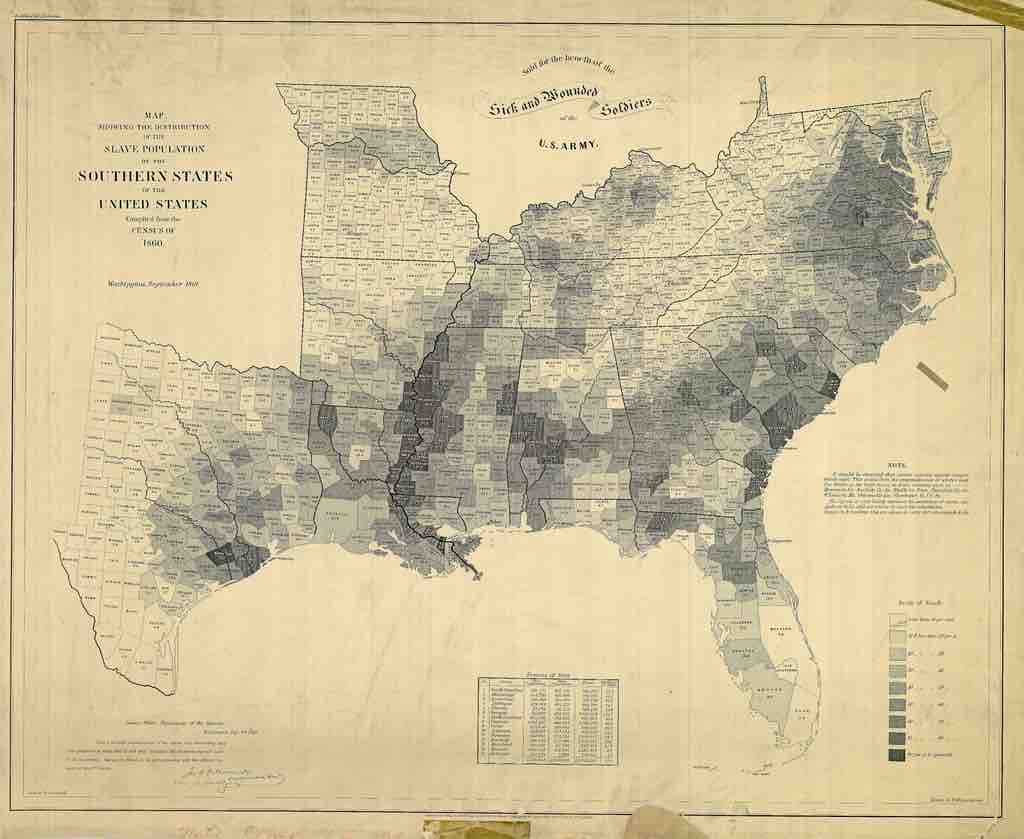
Map showing the distribution of the slave population of the US Southern states.
The map, compiled from the Census of 1860, was sold for the benefit of sick and wounded soldiers of the US Army.
A table at the bottom of the map lists 1860 census data from fifteen southern states: South Carolina, Mississippi, Louisiana, Alabama, Florida, Georgia, North Carolina, Virginia, Texas, Arkansas, Tennessee, Kentucky, Maryland, Missouri, and Delaware The table lists the free population, slave population, total population, and percentage of slaves in each of these states. South Carolina has the highest percentage of slaves (57.2%) and Delaware has the lowest percentage of slaves (32.2%). The map itself further illustrates the census data by displaying the percentage of slaves by county using a nine-point “Scale of Shade.” Counties whose slave population is less than 10% are shown in white. On the opposite end of the scale, counties whose slave population is 80% or more are shown in black.
Source
Boundless vets and curates high-quality, openly licensed content from around the Internet. This particular resource used the following sources:
"SlavePopulationUS1860."
http://en.wikipedia.org/wiki/File:SlavePopulationUS1860.jpg
Wikipedia
Public domain.