When you need to summarize quantitative data, words can only go so far. Sometimes, using a chart, graph, or other visual representation can be useful in proving your point. However, it's important to make sure you incorporate this extra information in a way that is easy to understand and in line with the conventions of APA style.
APA specifies two methods for representing information visually: tables and figures.
Tables
A table is a chart that presents numerical information in a grid format. APA style recommends that a table be used only for particularly complex data or large data sets; if your table has only one or two columns, you should summarize the information within the text of a paragraph instead.
In APA style, you must include each table on its own separate page at the very end of your paper, after the References section. (Note that these pages should still include the running head and page number.) Because tables are in a separate section, you must refer to each one in the text of your paper by its number (e.g., "Table 1") so the reader knows where it is relevant.
Formatting
Format your tables as simply as possible. Do not use bold or italicized text (unless you are talking about a variable or statistical test that requires such formatting).
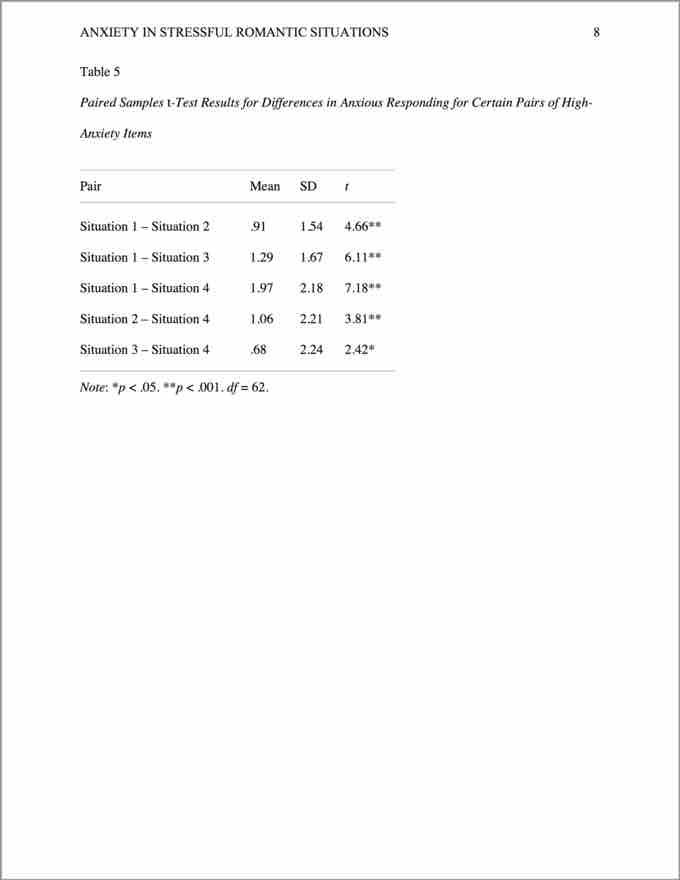
APA style has strict rules about how to format the borders, or the lines, of your table. Generally, for simpler tables, you should have only three horizontal lines: one immediately above and one immediately below the column headings, and one at the bottom of the table.

Simple table
This table is properly formatted in APA style, using only three horizontal borders.
If you have a more complex table—e.g., one that has multiple layers of column headers or sections of data—you may sparingly use additional horizontal lines as visual separators.

Complicated table
This more complicated table is properly formatted in APA style; it uses more than three horizontal borders to clearly separate the different sections.
Title and Source
Every table should appear flush with the left margin. Immediately above the table, provide its number (e.g., "Table 1"), and then on the next line provide a short but descriptive title in italicized title case.
If your table includes any abbreviations that need defining, or statistics whose significance levels need noting, immediately below the table, write the word "Note" in italics, followed by a colon, and then provide the needed explanation.
If your table comes from another source, you need to add that source to your References section. Using the same formatting, you should also place that information immediately below your table, following the word "Source" in italics.
Figures
In APA style, you must also include each figure on its own separate page at the end of your paper; this section of figures should appear after the section of tables. (Note that these pages should also still include the running head and page number.)
Because figures appear separate from the body of your paper, you must refer to each one in the text of your paper by its number (e.g., "Figure 1") so the reader knows where it is relevant.
Formatting
APA style has strict rules about how to create and format your figures.
- Any text in a figure (e.g., axis labels, legend labels) should be in a sans-serif font, between 8pt and 14pt in size.
- One-column figures (e.g., a graph with a single panel) should be between 2 and 3.25 inches in width.
- Two-column figures (e.g., a graph with two panels) should be between 4.25 and 6.875 inches in width.

Single-panel figure
This is a single-panel figure properly formatted in APA style.
Title and Caption
Every figure should appear flush with the left margin. Immediately below the figure, provide its number (e.g., "Figure 1") in italics, followed by a period, followed by a brief but descriptive title (called a "figure caption") in sentence case. For example:
- Figure 1. Average self-reported anxiety of 18- to 24-year-old women in response to perceived social slight.
If your figure includes any abbreviations that need defining, or statistics whose significance levels need noting, include this information in the figure caption. For example:
-
Figure 1. Average self-reported anxiety of 18- to 24-year-old women in response to perceived social slight.
$^*p < .01.$
The title of the figure should not appear in the figure itself—it should appear only in the caption beneath the figure.

Three-panel figure
This is a three-panel figure properly formatted in APA style.