In mathematics, to solve an equation is to find what values (numbers, functions, sets, etc.) fulfill a condition stated in the form of an equation (two expressions related by equality). Each of the expressions contain one or more unknowns.
What is the graphical difference between equations with one variable and equations with two variables?
Graphs of Linear Equations with One Variable
A linear equation in one variable can be written in the form
For example, to graph the equation
-
$(1,-3)$ -
$(1,-2)$ -
$(1,-1)$ -
$(1,0)$ -
$(1,1)$ -
$(1,2)$ -
$(1,3)$
These can also be found by solving the equation of the graph for
The same is true for an equation written as
Therefore, when the equation is
Graphs of Equations with Two Variables
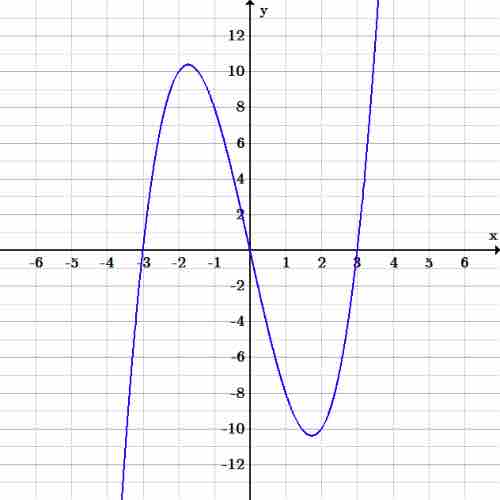
The graph of a cubic polynomial has an equation like
Plot specific points by substituting chosen
Let's choose values for
Therefore,
After substituting the rest of the values, the following ordered pairs are found:
-
$(-1,8)$ -
$(0,0)$ -
$(1,-8)$ -
$(2,-10)$
After graphing the ordered pairs and connecting the points, we see that the set of (infinite) points follows this pattern:

Graph of $y=x^3-9x$
Since the exponent of