Single Inequalities in Two Variables
The simplest inequality to graph is a single inequality in two variables, usually of the form:
Graphing an inequality is easy. First, graph the inequality as if it were an equation. Remember that the solutions to an equation in slope-intercept form are all ordered pairs that satisfy the equation, or make the statement true. Therefore, if an inequality in two variables has an
Second, shade either above or below the line, depending on if
Graph a Single Linear Inequality in Two Variables
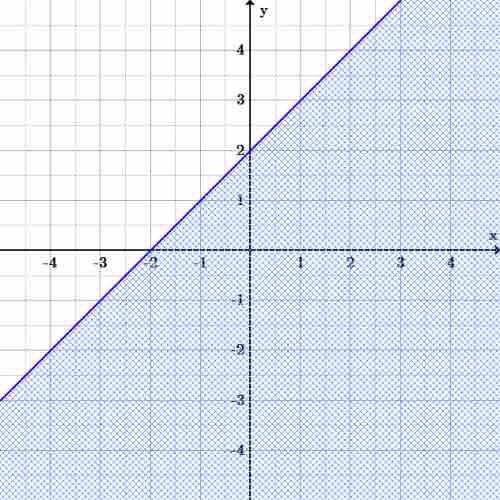
Example: Sketch the graph of $y\leq x+2$
Since the equation is less than or equal to, start off by drawing the line

Inequality graph
Graph of
How to Graph Multiple Linear Inequalities in Two Variables
Now if there is more than one inequality, start off by graphing them one at a time, just as was done with a single inequality. To find solutions for the group of inequalities, observe where the area of all of the inequalities overlap. These overlaps of the shaded regions indicate all solutions (ordered pairs) to the system. This also means that if there are inequalities that don't overlap, then there is no solution to the system.
Example: Sketch the graph of $y<-\frac{1}{2}x+1$ and $y\geq x-2$

Graph of two inequalities
The overlapping shaded area is the final solution to the system of linear inequalities because it is comprised of all possible solutions to